Script Planner Assistant▸
 AI Apps
 AI News

DataRoom: Open-Source Large Screen Visual Designer Based on Vue
DataRoom: Open-Source Large Screen Visual Designer Based on VueIntroduction
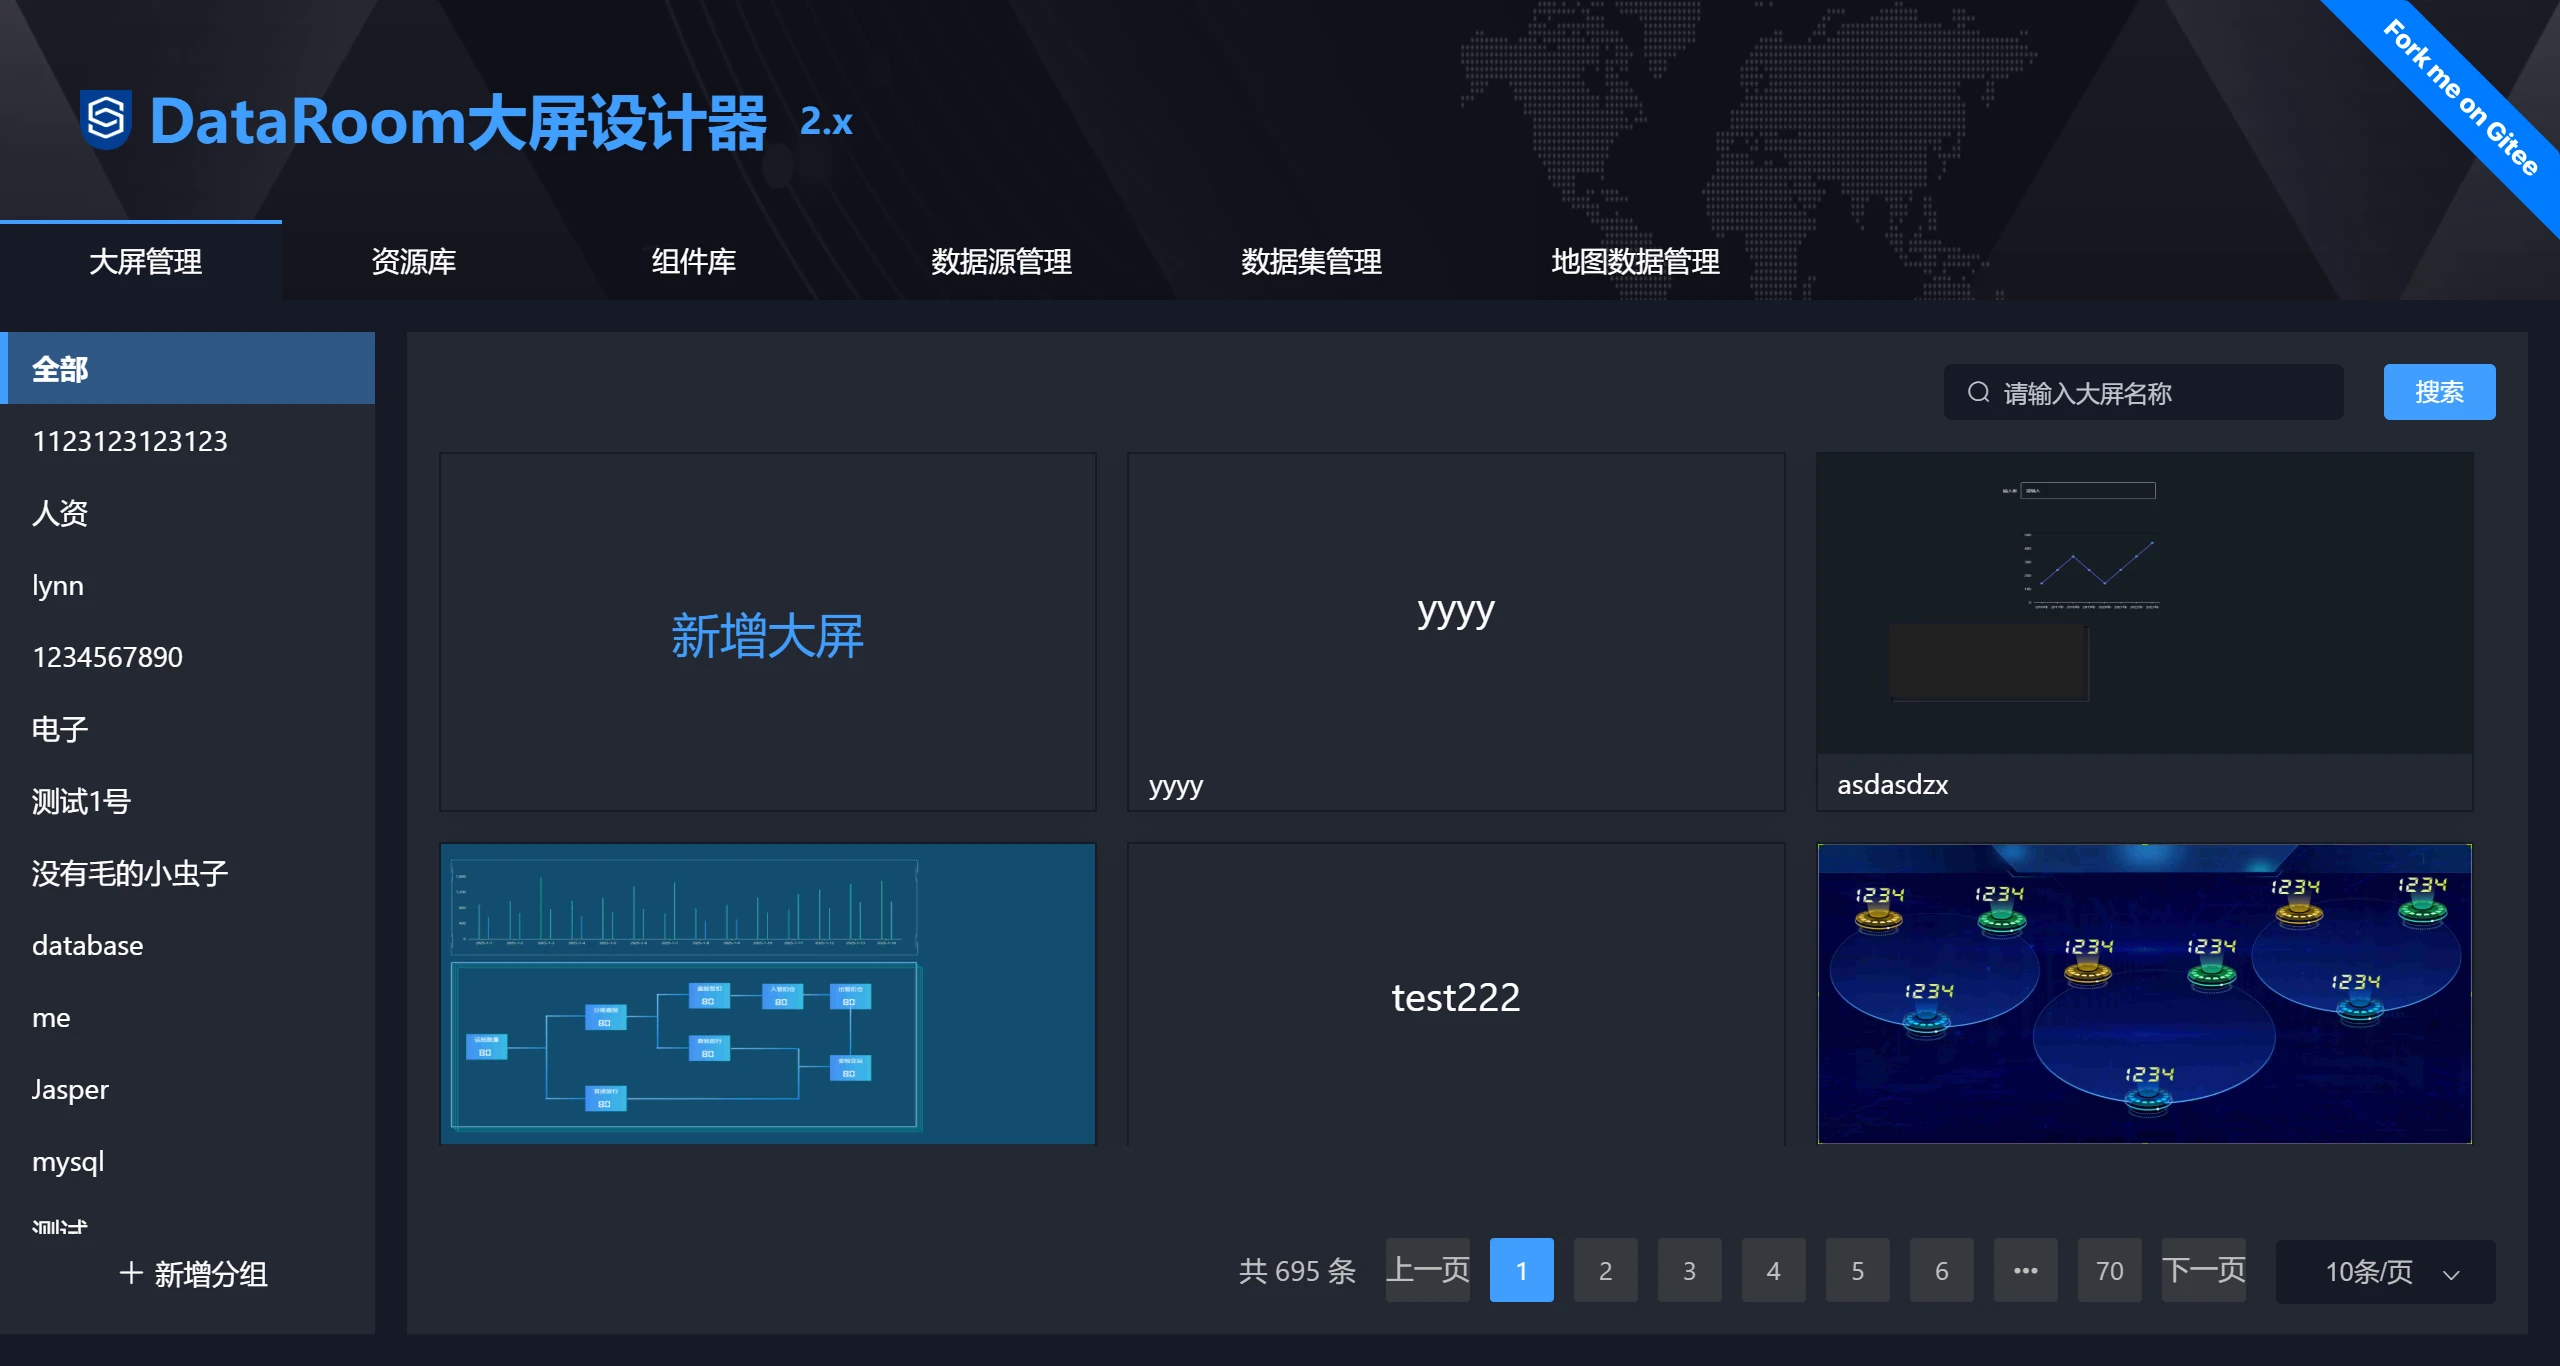
DataRoom is a highly integrated, open-source tool for large-screen design and data visualization. It is built on technology stacks including SpringBoot, MyBatisPlus, Vue, ElementUI, G2Plot, and Echarts. DataRoom aims to simplify the large-screen design process and provides a full-chain solution from data ingestion to display. It is particularly suitable for scenarios where dynamic data display interfaces need to be created. Most importantly, it is completely free to use and the code is open source.
DataRoom Core Features
Data Management: Supports multiple data source integrations such as MySQL, Oracle, PostgreSQL, HTTP, and Groovy scripts, meeting complex data processing requirements.
Visualization Design: Leverages G2Plot and Echarts to provide a rich variety of chart types, such as line charts, pie charts, radar charts, etc., enabling intuitive data visualization.
Flexible Component Management: Supports both online and offline component development. The component-based design facilitates reuse and improves design efficiency.
Permission Control: Supports custom interface permissions and data permissions. It can integrate with the project's existing permission management system to complete security control over large screens. The large-screen management homepage supports custom grouping of large screens, allowing you to design, edit, and preview each large screen directly.
Resources and Component Library: Comes with a large number of built-in design resources, including icons, backgrounds, etc., and supports custom uploads to enrich design elements.
Deployment Flexibility: It can be deployed independently without interfering with existing projects, and can also be embedded into new projects, reducing operational and maintenance costs.
User-Friendly: Provides large-screen management, preview, export functions, and canvas editing tools such as component frame selection, grouping, and animation settings.
DataRoom Application Scenarios
Enterprise-Level Large-Screen Display: Used within enterprises to monitor business metrics, market trends, production data, etc.
Data Analysis Reports: Provides decision-makers with a real-time, intuitive data analysis interface.
Public Information Display: Such as information display screens at airports and stations, showing real-time flight and train information.
Education and Training: Used for data visualization demonstrations in teaching to help students understand complex data relationships.
DataRoom Technical Architecture
SpringBoot: Serves as the backend framework, responsible for the business logic processing, data interaction, and security control of the entire system.
MyBatisPlus: An enhanced version of the MyBatis ORM framework that simplifies database operations and supports multiple databases such as MySQL, Oracle, PostgreSQL, etc.
ElementUI: A Vue.js-based frontend UI component library used to build beautiful and responsive user interfaces.
G2Plot: An encapsulated component based on the G2 chart library that provides a rich variety of chart types and configuration options.
Echarts: A powerful JavaScript chart library used to generate intuitive data visualization effects.
DataRoom is completely free and open source, making it suitable for projects that require large-screen design and data visualization. It has very comprehensive installation and deployment documentation, and can be perfectly integrated into your own project directly. You can go to the DataRoom demo address to experience it—you will definitely love it!
GitHub: https://github.com/gcpaas/DataRoom