Script Planner Assistant▸
 AI Apps
 AI News

KuaiZhi Charts: Easy Chart & Report Maker for Beginners
KuaiZhi Charts: Easy Chart & Report Maker for BeginnersIntroduction
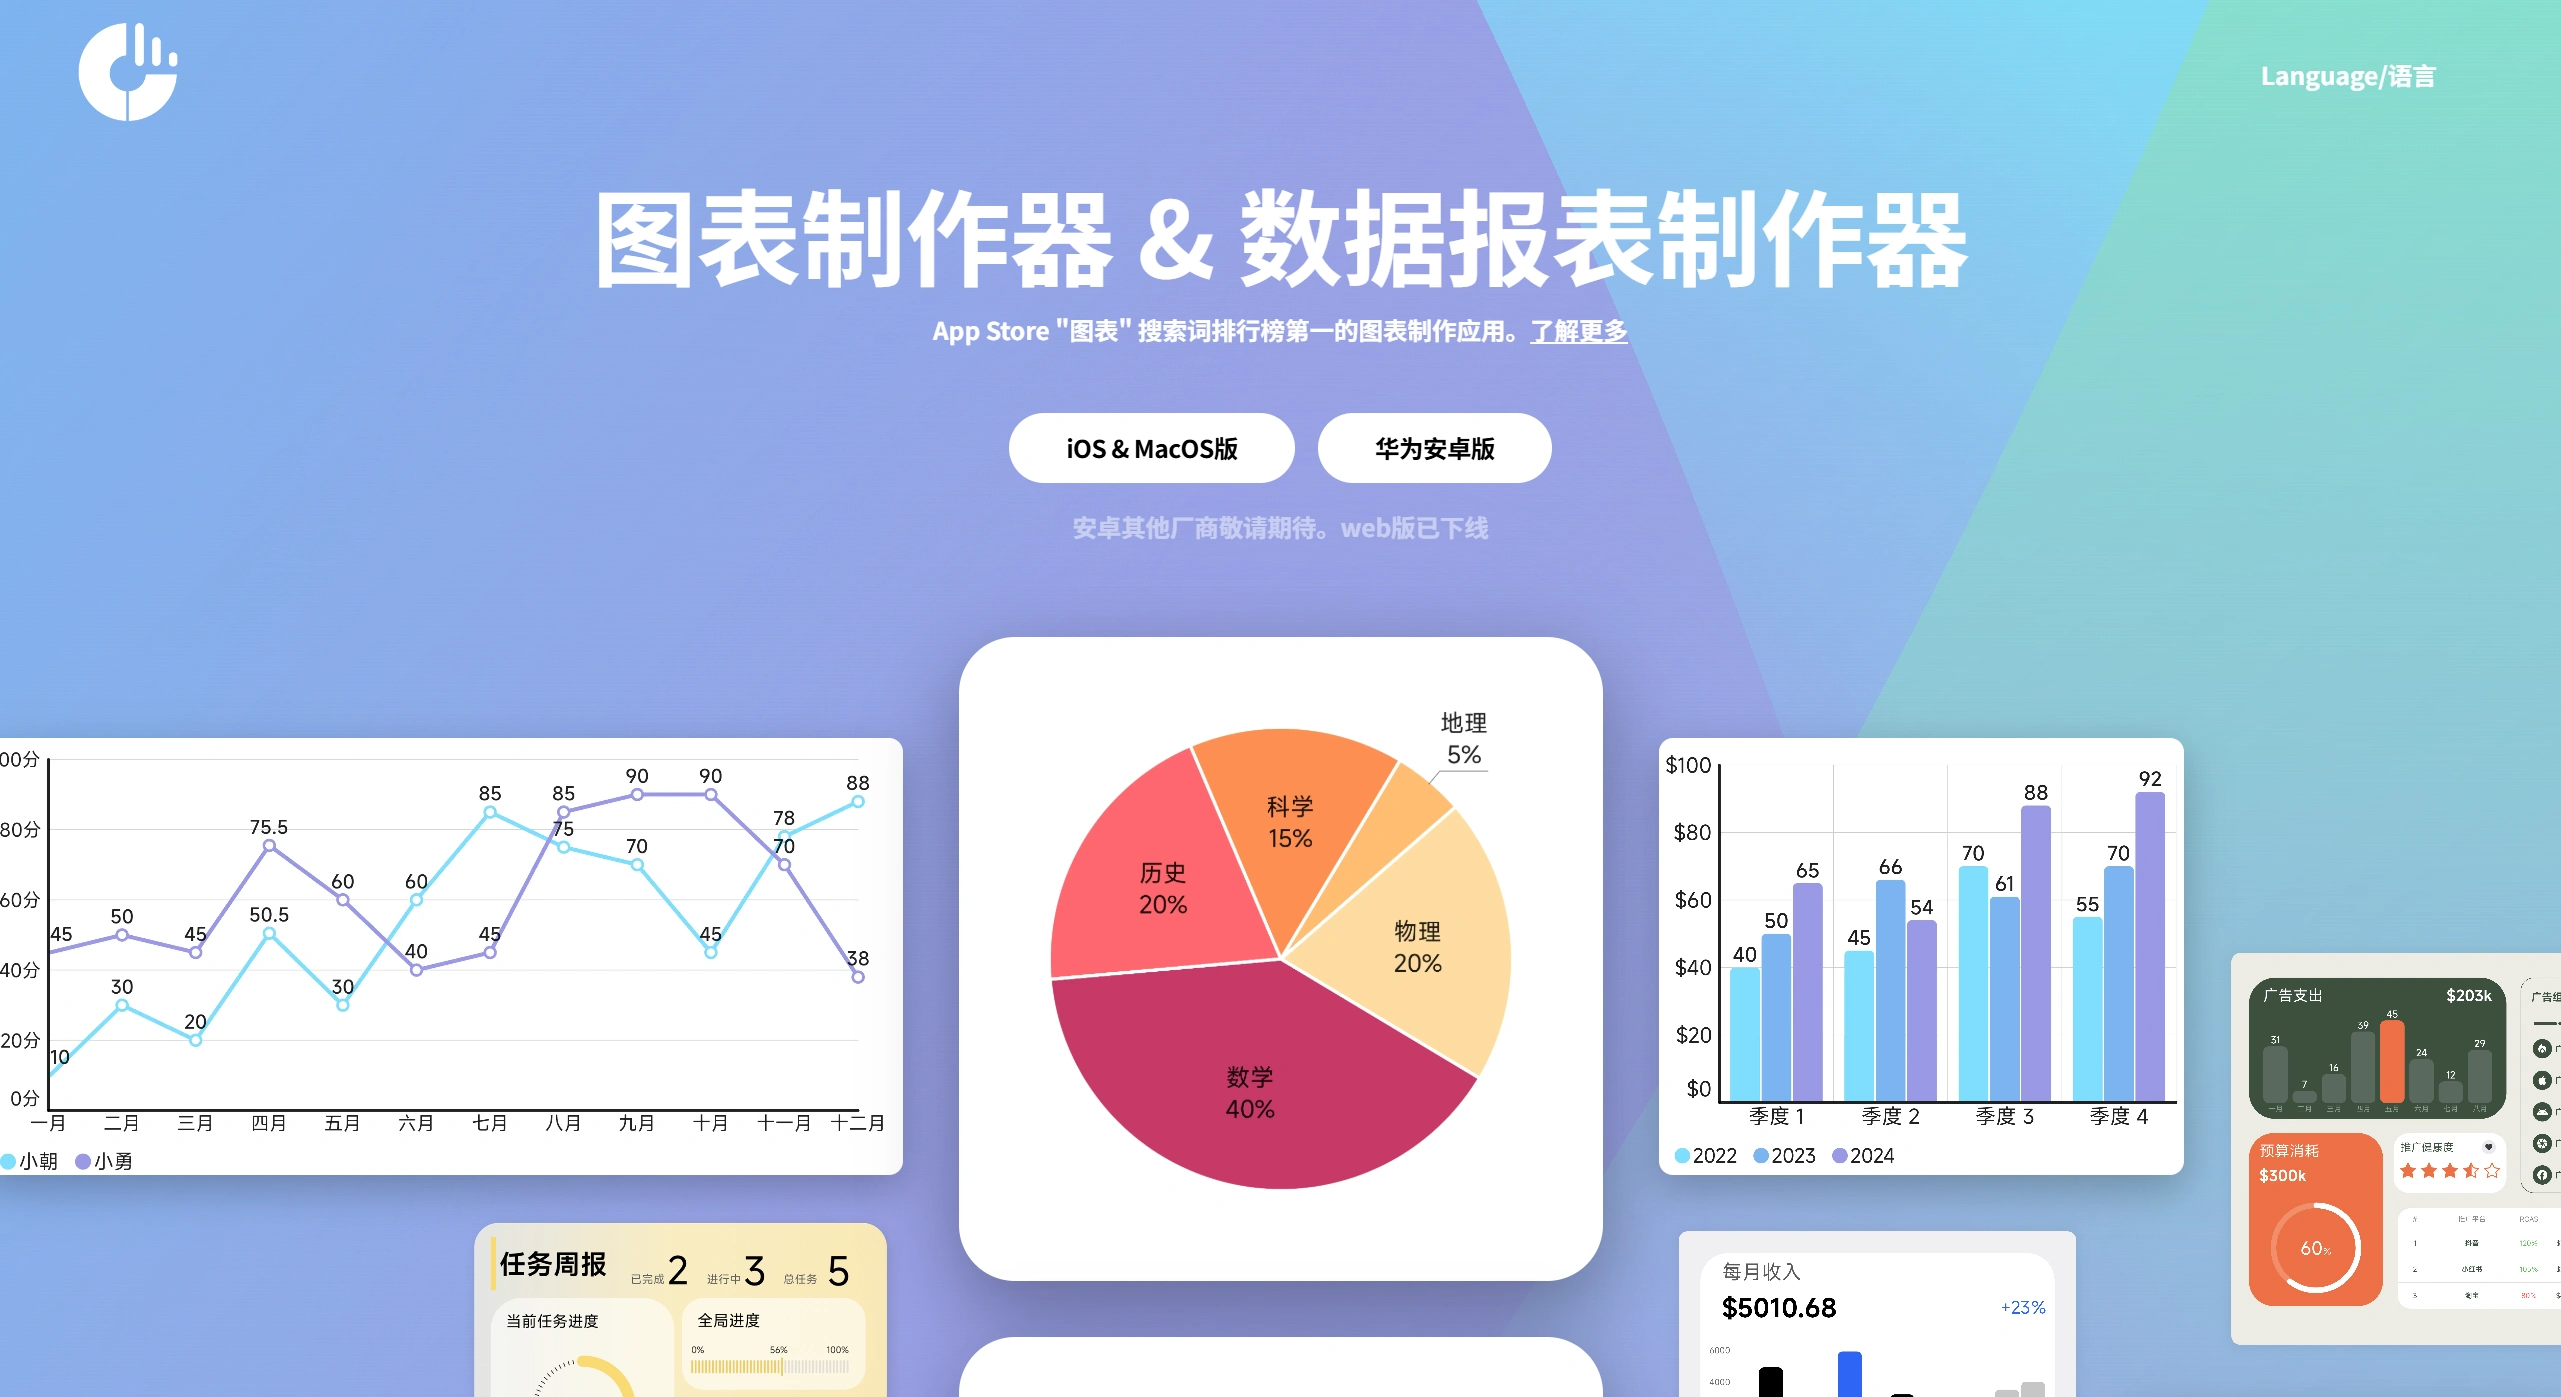
快制图表 is a chart and report making tool that beginners can easily get started with. It can create common charts like pie charts and line charts, as well as commonly used ppt elements like linear progress bars. The operation is extremely simple—you can get started at a glance. It supports Excel data import and one-click conversion into charts, and you can adjust the appearance yourself. It is suitable for posting social graphics, making PPTs, reporting data, writing papers, and various other scenarios.
Features of 快制图表
Zero learning curve: Create charts by simply dragging and dropping. Customize over 10 appearance settings like colors, fonts, bar thickness, and rounded corners. Changes take effect immediately—no formulas or commands required.
Comprehensive chart library: Offers 15 basic chart types at once, including pie/donut charts, line charts, area charts, vertical/horizontal bar charts, stacked bar charts, radar charts, scatter plots, funnel charts, butterfly charts, Sankey diagrams, and combo charts. It also includes commonly used dashboard components like KPI cards, line/circular/wave progress bars, Venn diagrams, pyramid charts, and org charts.
Flexible data handling: You can create tables directly within the App (supporting up to 100×100 cells), or one-click import local Excel or CSV files. Modify the original table and the chart will update automatically.
Customizable appearance: Colors, sizes, themes, background images, transparency, shadows, 3D tilt angles can all be adjusted. You can also save them as "personal templates" for direct reuse next time.
Fast export & sharing: Export in three high-definition formats—PNG, PDF, and SVG—without watermarks. The iOS version can also be transferred directly to Mac, or shared with one click to WeChat/QQ/DingTalk.
Great offline experience: No ads, no paid features, no registration or login required. The installation package is less than 40MB, so it works even on flights without internet.
Use Cases for 快制图表
Workplace reportingings: Create sales monthly reports, financial summaries, and project progress dashboards—just use a template and fill in the numbers to generate the chart.
Academic research: Create line charts for experimental data, comparative radar charts, and scatter correlation plots. Export directly as 300dpi high-definition images for papers.
E-commerce operations: Create real-time sales KPI dashboards for live-streaming e-commerce. Combine progress bars and percentage donut charts into a large screen for mobile casting.
Education/Students: Create class grade distribution histograms, personal fitness check-in curves, and postgraduate entrance exam countdown progress bars. Switch templates and you're ready to go.
Government/Public welfare: Create community census pyramid charts and waste classification percentage pie charts, quickly generating publicly-shareable graphics.
How to Use 快制图表
Choose a chart: Open 快制图表 App → tap "+" at the bottom → select from 15 chart types and over 20 dashboard components.
Fill in data:
Create table online: Enter row and column names as prompted, fill in numbers, and add/delete rows and columns as needed;
Import Excel: Tap "Import" → select file → automatically recognize headers → confirm.
Beautify & export:
In the "Appearance" tab, adjust colors, fonts, units, and decimal places;
Tap "Export" in the top right → select PNG/PDF/SVG → save to album or share directly.
Advanced usage: For creating a large screen dashboard, return to the home page → create a new "Dashboard" → drag the completed chart cards, KPIs, and progress bars onto the canvas → unify the background color → export the entire long image, which becomes a "data story wall" suitable for PPTs.
FAQ
What data import methods are supported? Is it difficult to operate?
It supports both importing tables from Excel and creating tables online, both can convert to charts with one click. The operation is extremely simple—the interface is intuitive, appearance changes take effect immediately, and you can get started in minutes.
Besides pie charts and line charts, what other special charts and elements are available?
Special charts include radar charts, funnel charts, butterfly charts, scatter plots, stacked bar charts, curve charts, etc.; additional elements include linear/circular progress bars, Venn diagrams, and structure charts commonly used in PPTs.
What scenarios are different charts suitable for?
Bar charts are suitable for comparing different variables, horizontal bar charts are suitable for ranking lists; line charts are suitable for observing data changes over time; butterfly charts are suitable for comparing multiple variables of two products, allowing you to see at a glance which one performs better.
"快制图表" is like a mini BI tool in your phone: the most chart varieties, the most flexible color customization, and no ads offline; you can complete "fill in data → generate chart → export" in 3 steps, suitable for all scenarios where you need to "turn numbers into beautiful images right away."