Script Planner Assistant▸
 AI Apps
 AI News

Pyecharts-Gallery: A Data Visualization Gallery with Rich Chart Types
Pyecharts-Gallery: A Data Visualization Gallery with Rich Chart TypesIntroduction
What is pyecharts-gallery?
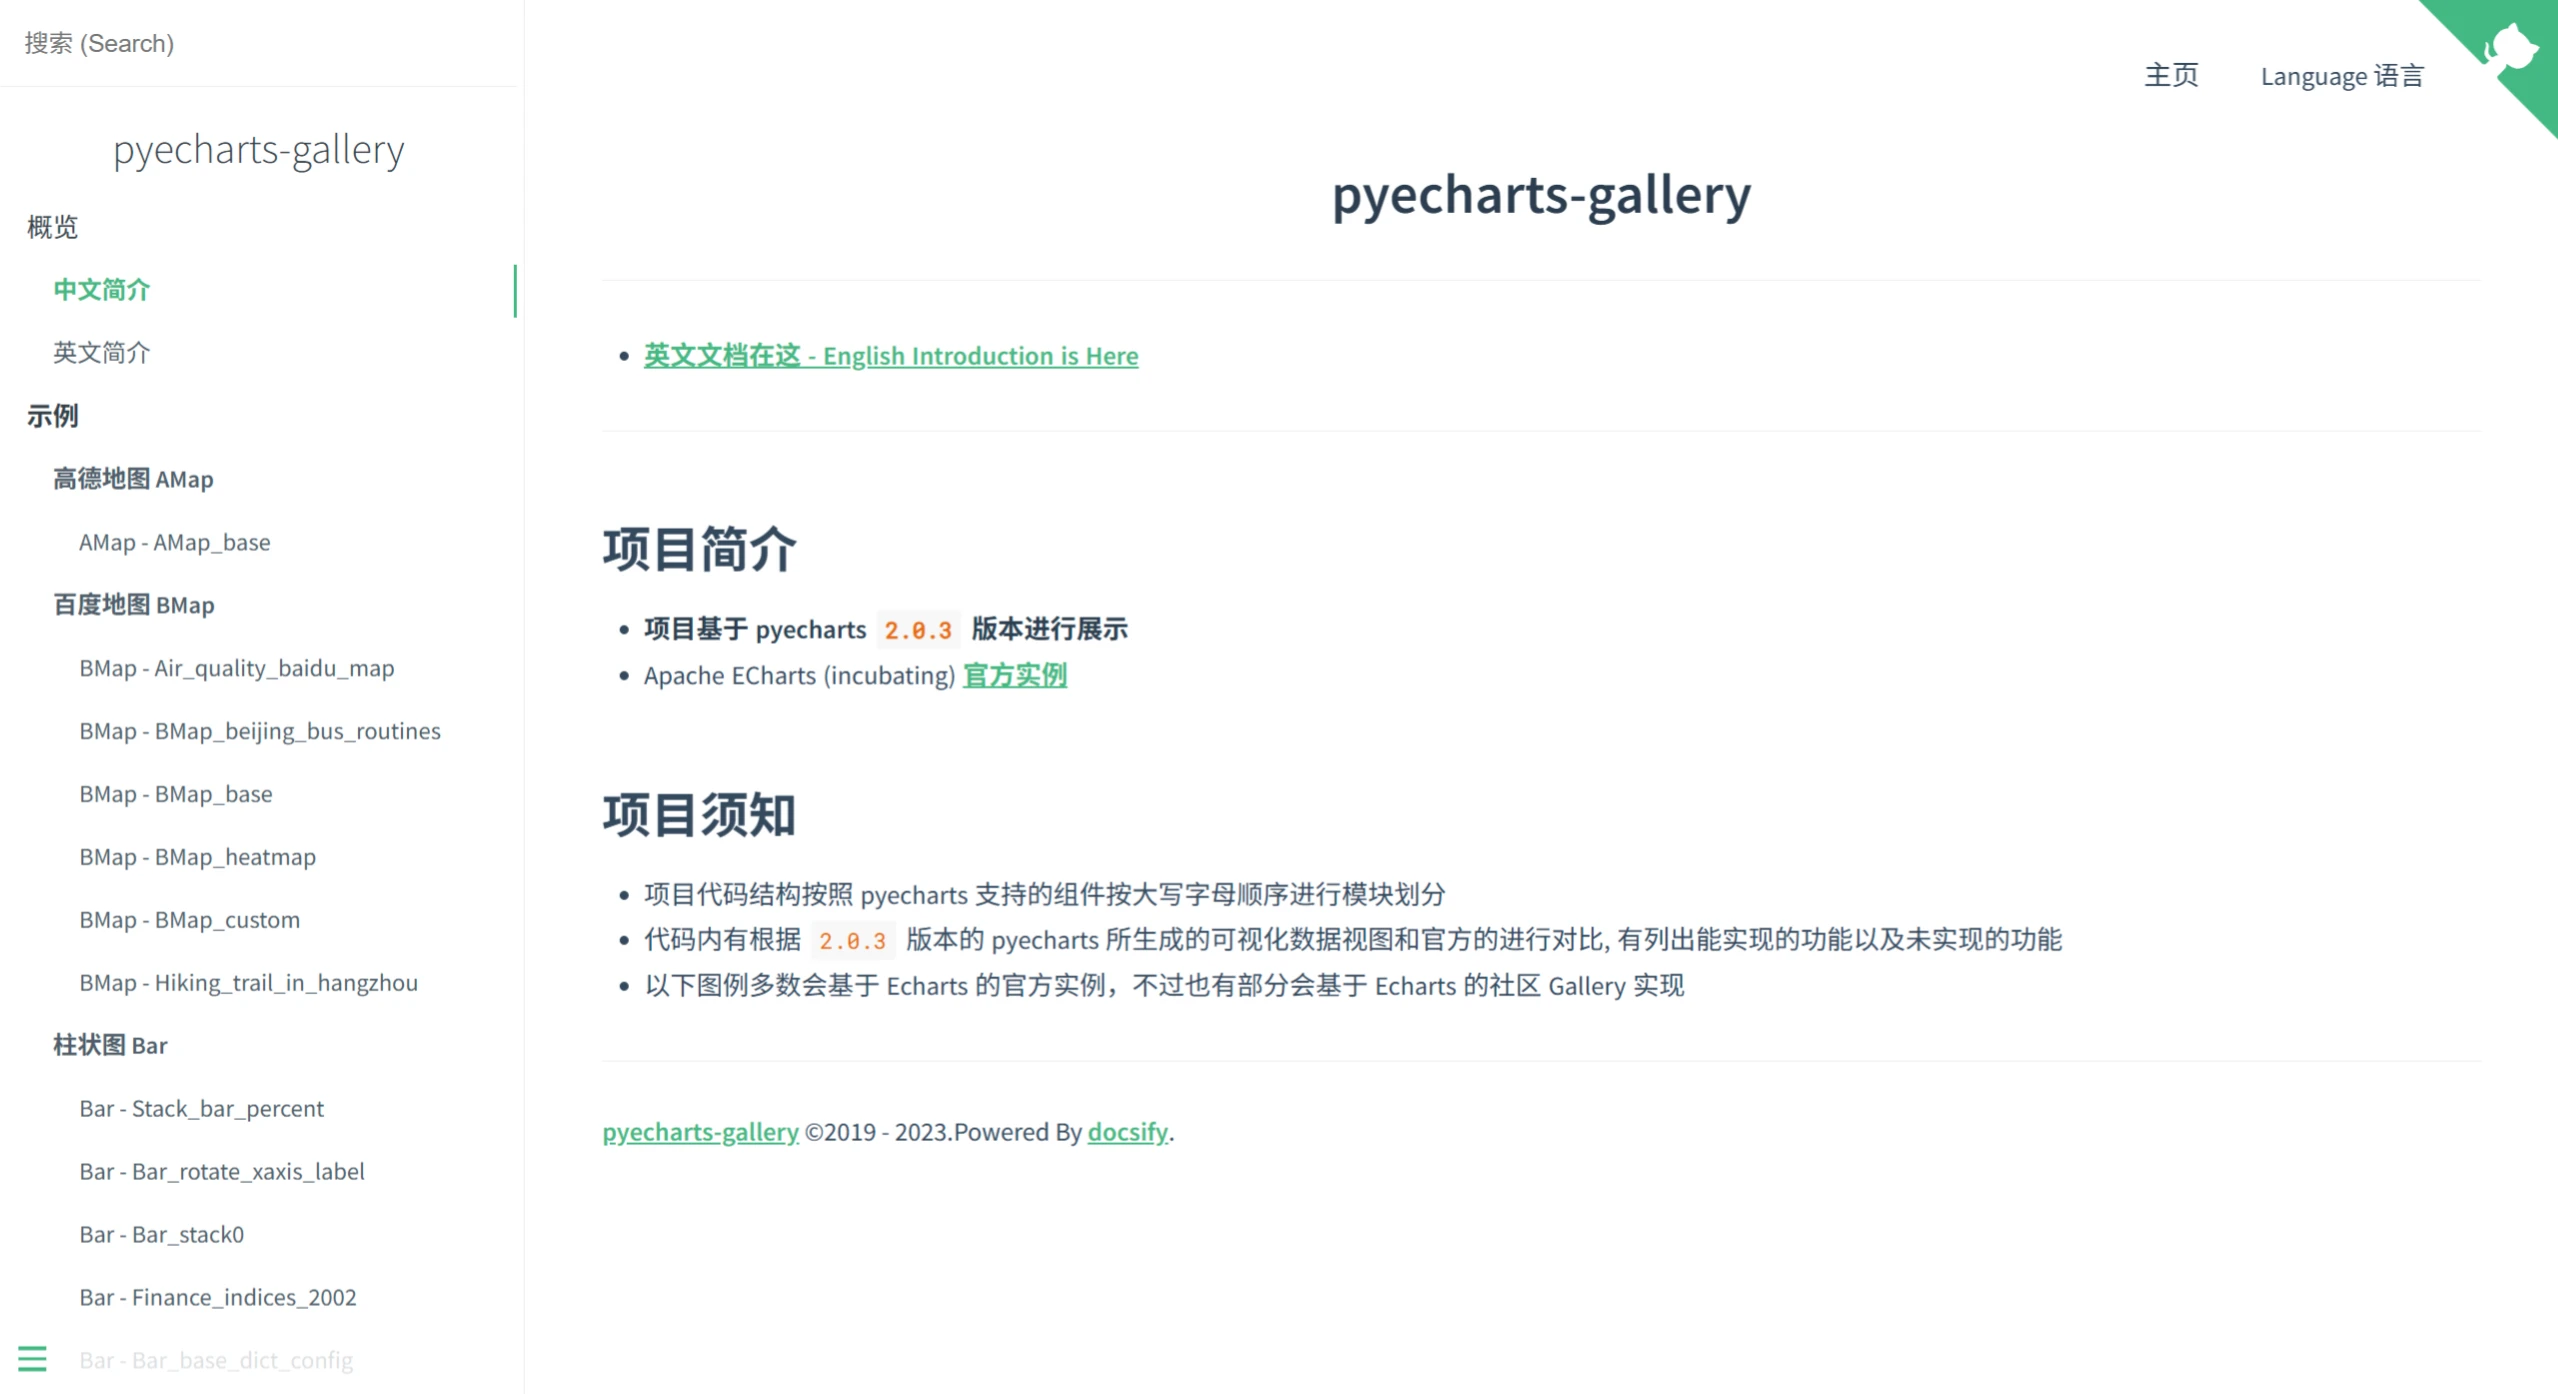
pyecharts-gallery is an open-source project based on pyecharts. By replicating the official ECharts examples, it showcases the data visualization capabilities of pyecharts. In addition, it also serves as a data visualization gallery, providing a rich variety of chart types and example code to help developers quickly get started with and use pyecharts.
pyecharts-gallery typically contains a series of example code that demonstrates how to use pyecharts to create different types of charts, such as line charts, bar charts, pie charts, scatter plots, maps, and more. These examples can help developers quickly get started with pyecharts and understand its rich features and configuration options.
Main Features of Pyecharts-Gallery
Rich chart types: includes bar charts, line charts, pie charts, scatter plots, maps, and many other common chart types.
Code examples: provides a large number of chart code examples based on pyecharts, which users can run directly or modify and apply to their own projects.
Comparison with ECharts: the project compares the visualizations generated by pyecharts with the official ECharts charts, listing the features that can be implemented and those that have not yet been implemented.
Interactivity: demonstrates how to leverage ECharts' interactive features, such as data zooming, tooltips, legend toggling, etc.
How to Use Pyecharts-Gallery
Clone the project:
git clone https://github.com/pyecharts/pyecharts-gallery.git
cd pyecharts-gallery
Install dependencies:
pip install -r requirements.txt
Run examples:
python run_all.py
After running, you can view the chart effects in the generated HTML files.
Application Scenarios of Pyecharts-Gallery
Beginners: quickly learn how to use pyecharts through example code.
Developers: can directly reference or modify the example code to quickly meet data visualization needs.
Github:https://github.com/pyecharts/pyecharts-gallery