Script Planner Assistant▸
 AI Apps
 AI News

Aitubiao – AI-Generated Beautiful Charts, Infographics & Data Dashboards
Aitubiao – AI-Generated Beautiful Charts, Infographics & Data DashboardsIntroduction
What is Aichart?
Aichart is an AI chart tool, an intelligent data visualization platform launched by Dydata Tech. Through end-to-end AI technology, it helps users easily create beautiful visualization charts, infographics, and data dashboards.
Aichart not only automatically generates professional charts, but also provides a Canva-like editor, allowing you to easily add text, images, and other elements to create complete graphic works.
Aichart is the first product in China to integrate DeepSeek into the chart scenario. By integrating cutting-edge DeepSeek series AI models, Aichart combines powerful data processing capabilities with intelligent features, dedicated to helping professionals efficiently process and present data, improving work efficiency and report quality.

Main Features of Aichart
AI Chart Generation: Aichart leverages AI technology to automatically recommend suitable chart types based on data characteristics and generate visually appealing chart styles.
AI Text Generation: The first product to integrate DeepSeek series AI models into the chart scenario, enabling intelligent text continuation, multilingual translation, and professional polishing.
Rich Chart Types: Supports bar charts, line charts, pie charts, radar charts, and more, meeting different data display needs.
Multiple Data Source Support: Users can easily import data from Excel, CSV, or databases, and the system automatically recognizes and processes data formats.
Multiple Export Formats: Supports export in JPEG, PNG, PDF, and other formats, making it convenient for users to use in different scenarios.
AI Image Generation: Unlimited generation of massive materials, providing AI intelligent cutout, enlargement, and other functions, helping users process material images needed for charts.
AI Data Analysis: Intelligently analyzes imported data, providing multidimensional analysis such as data trends, data comparisons, correlation analysis, distribution analysis, and generates text reports.
How to Use Aichart
1. Intelligent Chart Generation: Paste data to generate matching charts with one click
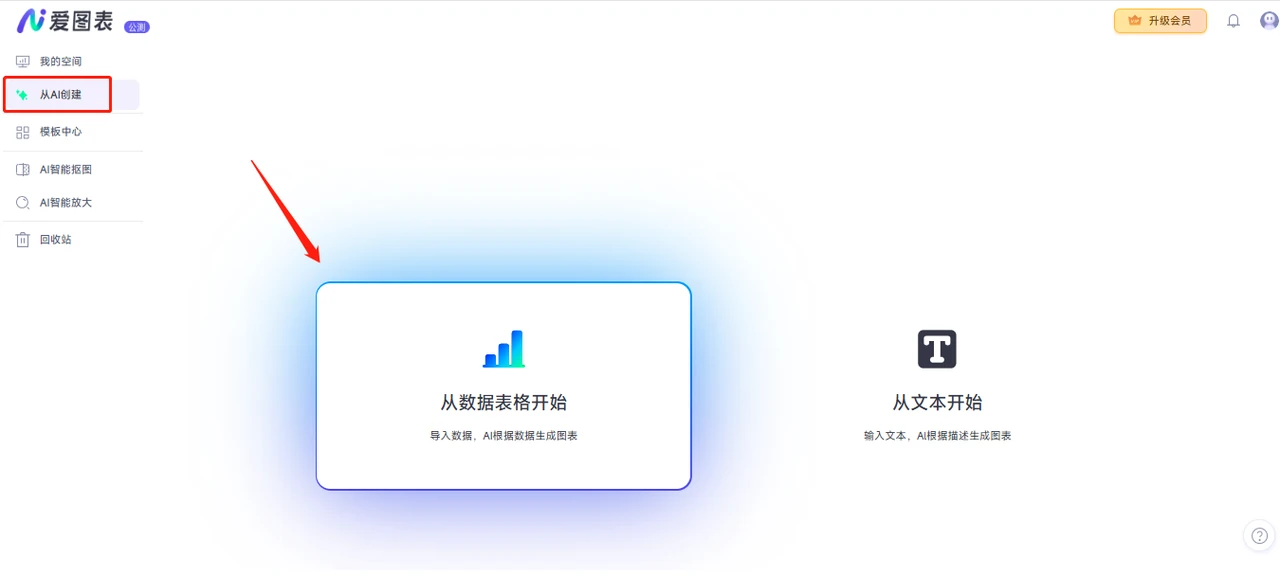
On the homepage, click [Create from AI] and choose to start from a data table
Click the upload data button at the top right, upload from local or directly copy data into the data table, select the needed data, and a chart matching the current data will be generated with one click
The generated chart can switch between multiple skins with one click to meet different scenario needs.
You can also customize and edit for more detailed adjustments and beautification based on your needs.
*The generated data dashboards, individual charts, and material images can all be separately exported to local.
2. AI Text-to-Text: One click to achieve intelligent text continuation, multilingual translation, and professional polishing.
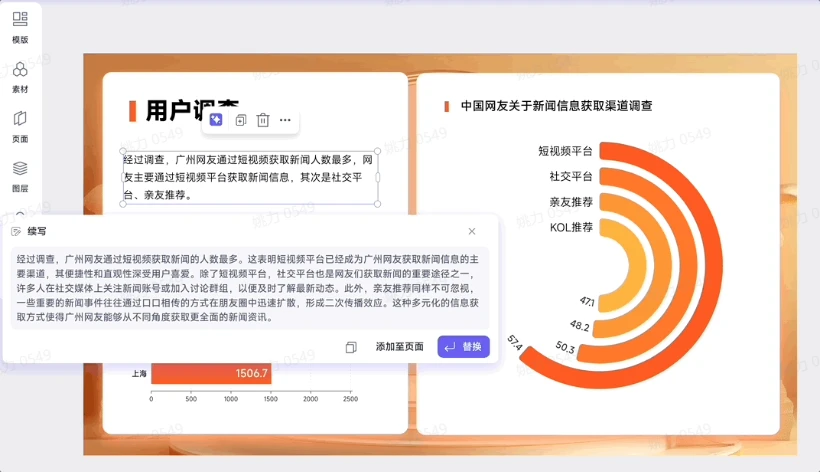
Randomly open a template in the homepage template center or open an existing project to enter the edit page, enter text, click the AI icon at the top left of the text, and you can continue, summarize, optimize, and translate the existing copy.
The generated copy can be inserted into the canvas with one click, quickly completing the conclusion output of data analysis.
3. AI Text-to-Image: Unlimited generation of massive materials, combined with intelligent cutout, lossless enlargement and other professional functions, greatly improving reporting efficiency.
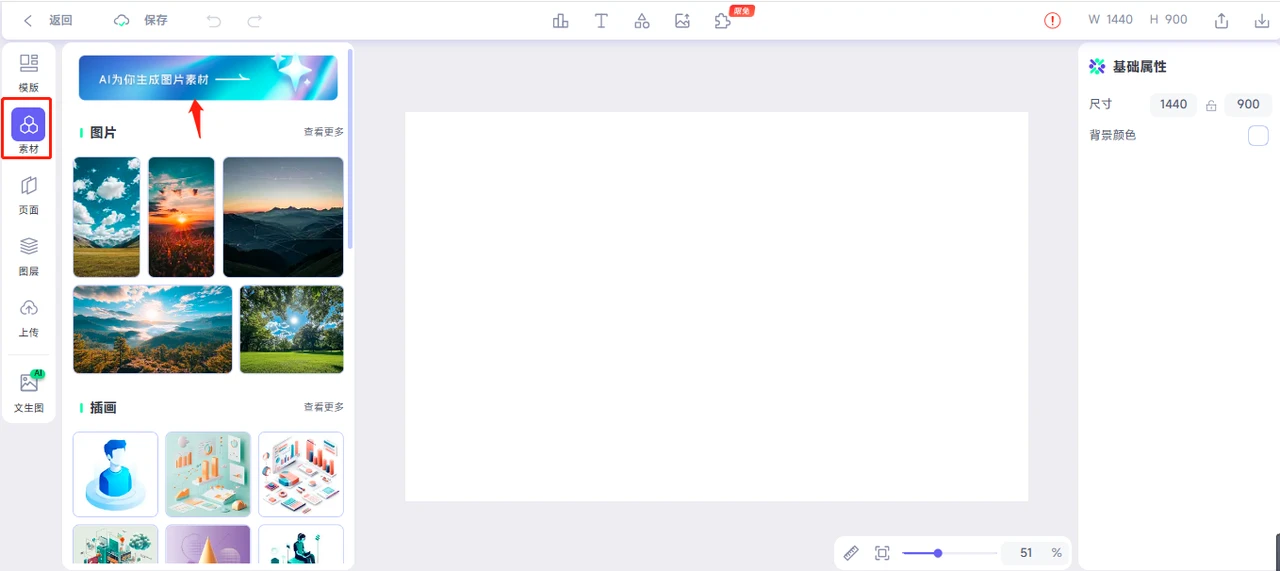
On the project edit page, click materials and select the AI-generate materials option at the top.
Enter a text description based on your needs, select style, size, and quantity, and AI will generate corresponding image materials
On the edit page, you can also perform intelligent cutout, lossless enlargement, cropping, adding filters, and adjusting color transparency on the generated images.
4. AI Image-to-Text: Automatically generates interpretive text based on charts, helping users quickly understand the meaning behind the data.
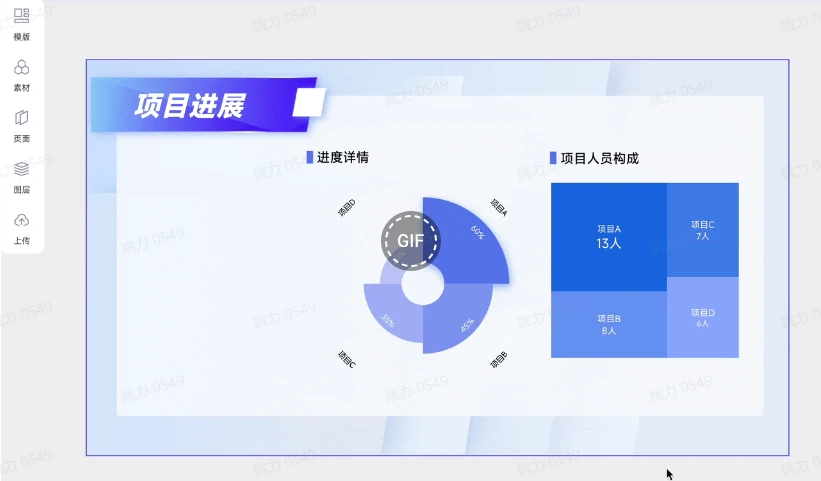
Aichart supports multidimensional analysis for charts and generates text reports. On the edit page, select the chart - click the icon at the top - select dimensions to analyze the chart data, and generate text to insert into the canvas.
Application Areas
Business Reports and Data Analysis
Suitable for internal corporate reporting, market analysis, sales data presentation, and other scenarios, helping users quickly generate intuitive charts and improve the professionalism and readability of reports.
Supports multiple chart types (such as bar charts, line charts, pie charts, radar charts, etc.), meeting different data display needs.
Social Media and Content Creation
Suitable for creating charts and graphic content for social media sharing, supporting export in JPEG, PNG, PDF, and other formats.
Provides rich templates and styles, allowing users to customize charts based on their needs.
Academic Research and Paper Writing
Helps researchers and students transform complex data into intuitive charts, aiding data analysis and result presentation.
Data Dashboards and Real-Time Monitoring
Supports creating data dashboards, suitable for real-time monitoring and displaying key metrics