Script Planner Assistant▸
 AI Apps
 AI News

DDChart: Online Chart Maker
DDChart: Online Chart MakerIntroduction
DDChart is an online chart-making tool that can create various types of charts and also supports custom word cloud images. Users just need to enter their data and click a few times to generate charts, such as common pie charts, bar charts, line charts, pictograms, 3D charts, and animated charts. It can also create word cloud images — where the shape, color scheme, and font can all be customized. In addition, the number of keywords in the word cloud can be manually controlled.
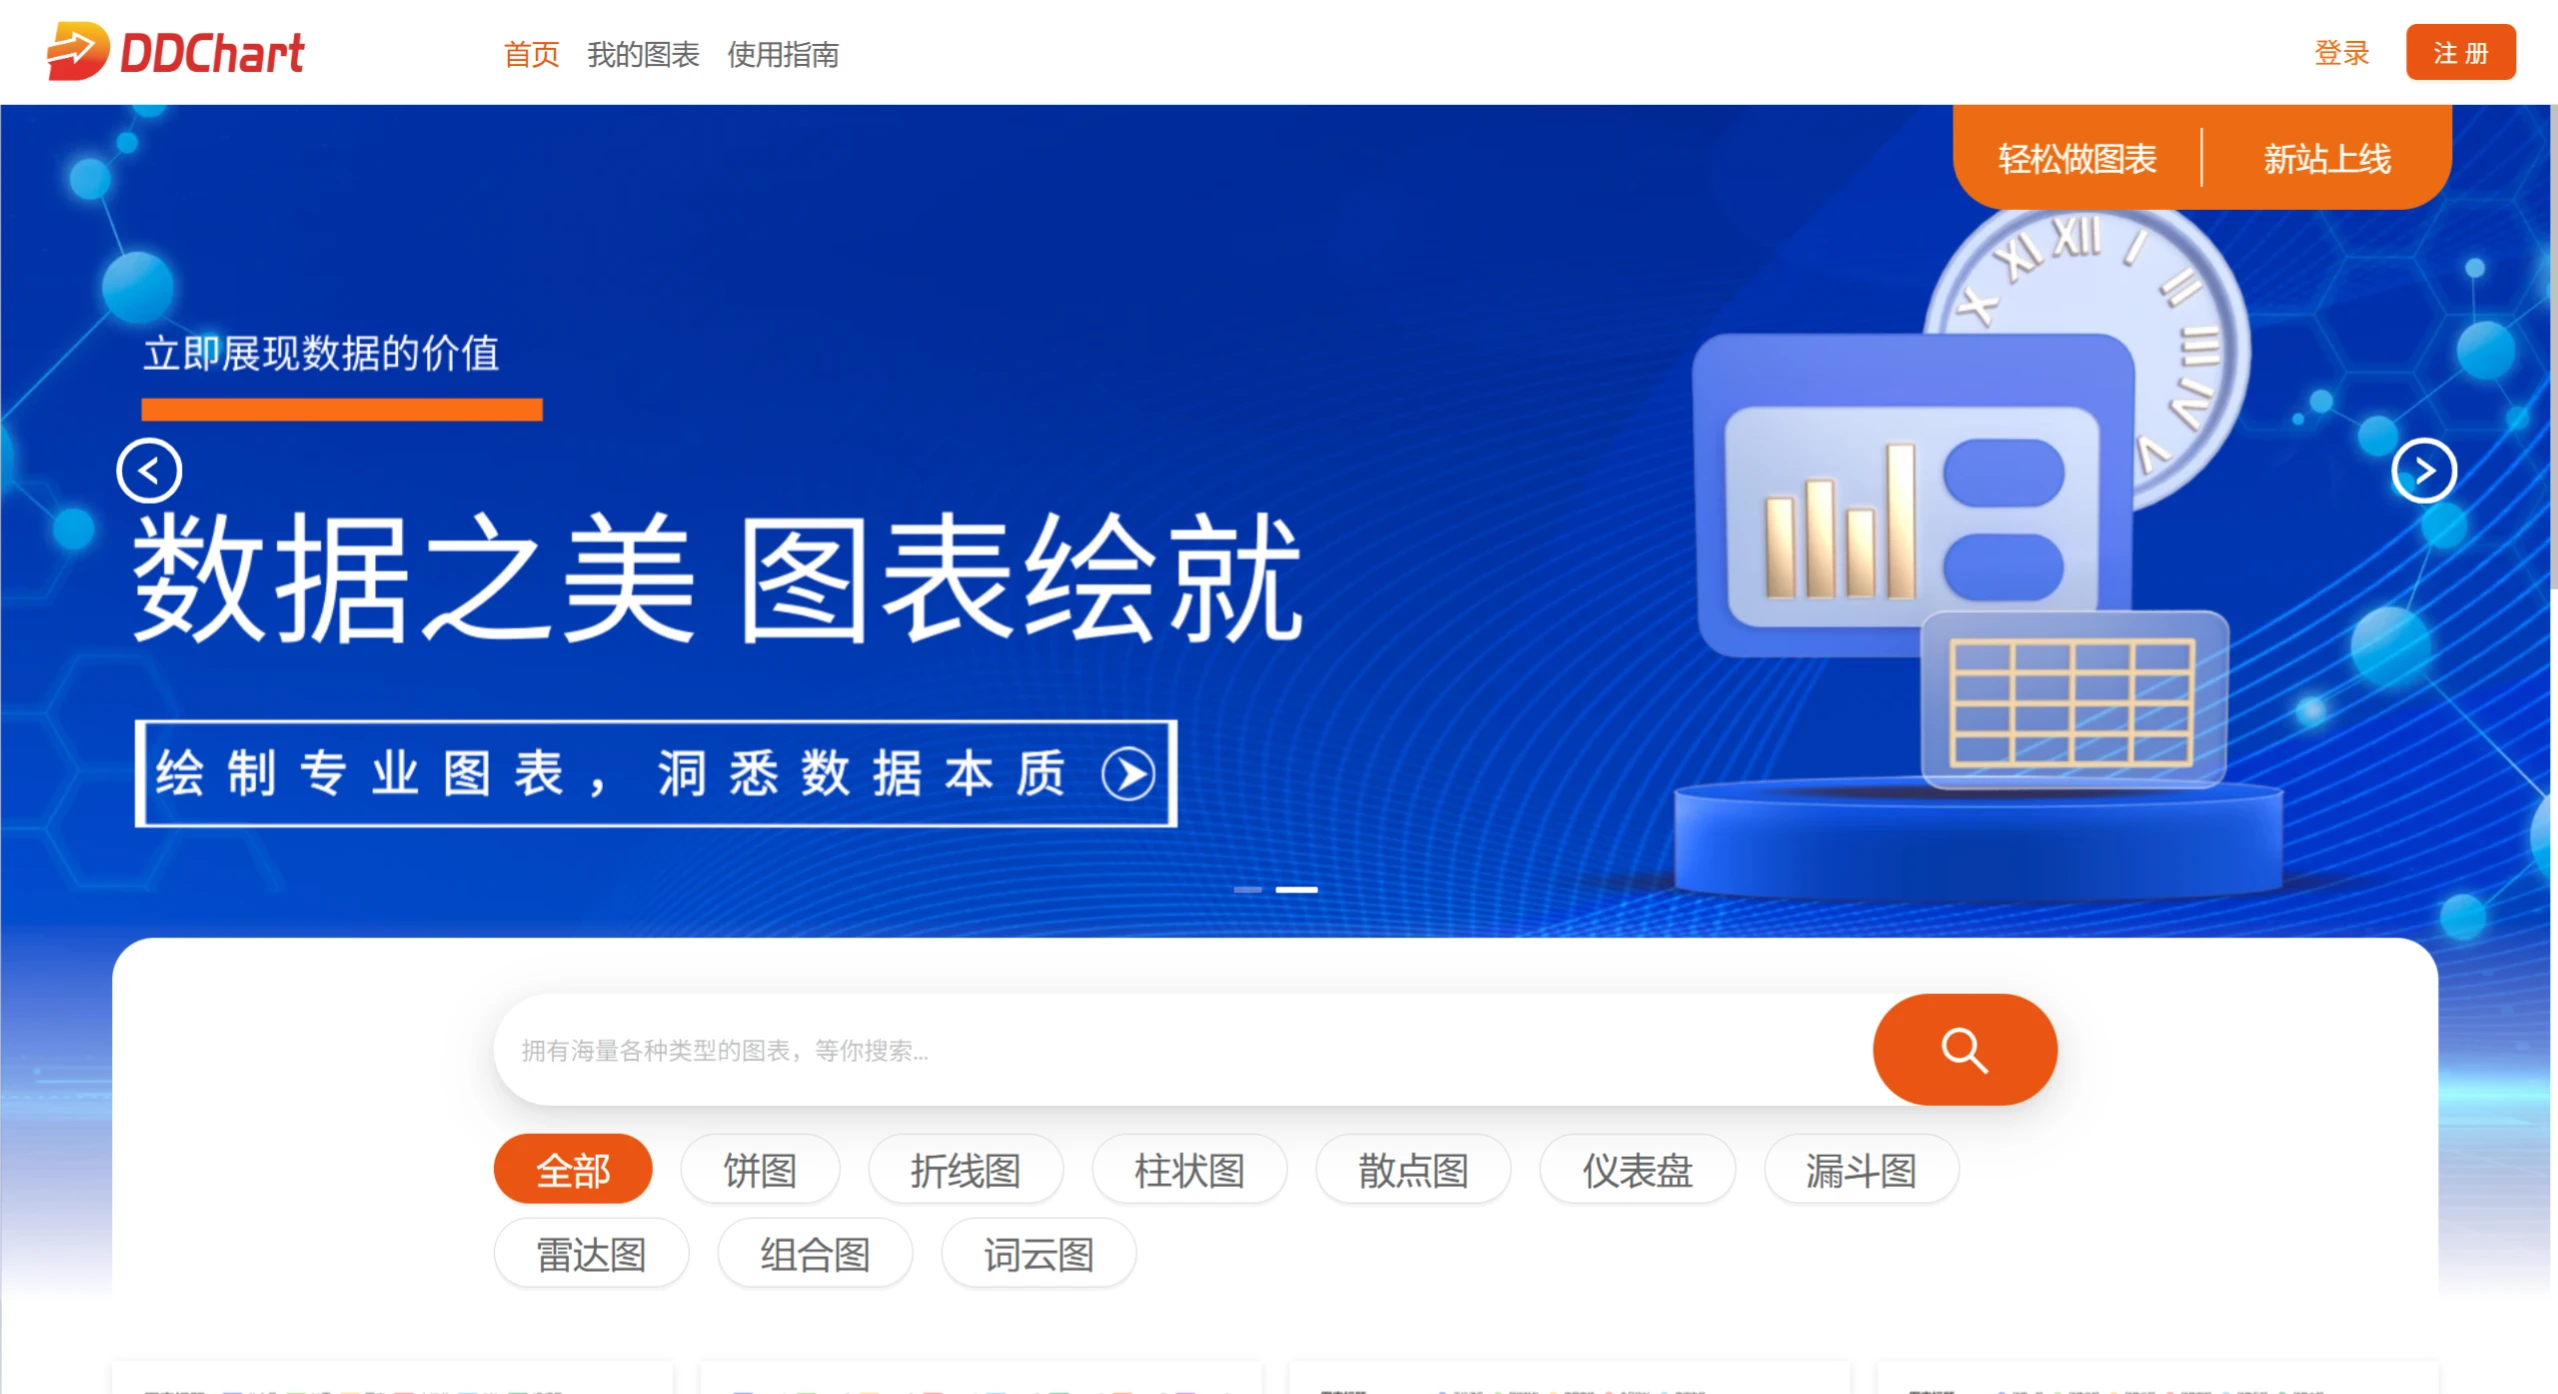
Specific Features:
Wide variety of chart types: basic options like pie charts, bar charts, line charts, pictograms, 3D charts, and animated charts are all available, plus a dedicated word cloud tool where the shape, color, and font can be changed.
Adjustable details: title, legend, size, color, radius, label line thickness, sort angle, and more can all be adjusted as needed.
Clear use cases: for common needs like customer conversion and churn analysis, or foot traffic analysis for sales stores, you can directly apply the matching chart template.
Simple operation: get it done in three steps — select the chart type, fill in the data, and adjust the style — and you can produce a chart in just a few minutes.
Other features: switch chart types at any time, reset the chart, view the help documentation, and also copy to clipboard or download images in PNG/JPG format.
Practical Applications:
Business analysis: create charts for sales, market trends, and financial data to keep an eye on key metrics and support decision-making.
Customer conversion analysis: use the "Expected vs. Actual Comparison Funnel Chart" to visually show the gap between actual conversions and expectations.
Store foot traffic analysis: use a single-axis bubble chart to show how foot traffic changes across different time periods.
Academic research: quickly display statistical data, suitable for classroom presentations or paper illustrations.
Marketing and promotion: create social media materials or ad effect images to showcase campaign results and user engagement data.
Personal use: track progress or results on goals, such as fitness data, study plans, etc.
How to Use?
Select a chart: go to the official website, click on the chart thumbnail on the homepage to choose a type.
Enter data:
directly modify the sample data, or paste in your own data;
or upload an Excel file to import.
Adjust style: use the right-side panel to change the title, legend, color, and other properties.
Other operations:
Switch chart type: after filling in the data, click the switch button — no need to re-enter the data;
Reset: click the reset button to return to the initial state;
Copy: click the copy button, and it can be pasted into WeChat/ppt/Word;
Download: choose PNG or JPG format to save locally.
Additional Word Cloud Operations:
Select the word cloud type to enter the editing page;
modify the keywords and their weights (default data is provided and adjustable);
change the shape, color scheme, and font — the effect updates in real time;
advanced settings let you control the number of keywords to avoid the image looking too empty.
Important Notes:
If you are not logged in, the charts you make can be downloaded but the data is not stored on the server, so it will be gone once you close the page; advanced charts and features require registration and login to use.