Script Planner Assistant▸
 AI Apps
 AI News

AiBiao: Instantly Turn Data into Charts
AiBiao: Instantly Turn Data into ChartsIntroduction
ai表 is a tool that quickly converts data into charts. It supports multiple chart formats including Excel and CSV, and can perform data querying, cleaning, merging, calculation, and analysis through natural language conversations. Users can input their analysis needs or chart descriptions to generate corresponding charts, supporting various types and styles, with one-click export of high-quality charts. In addition, it also provides intelligent web search functionality that can automatically capture and populate tables. Ai表 is applicable to e-commerce operations, finance, human resources, education and research, healthcare, and more.
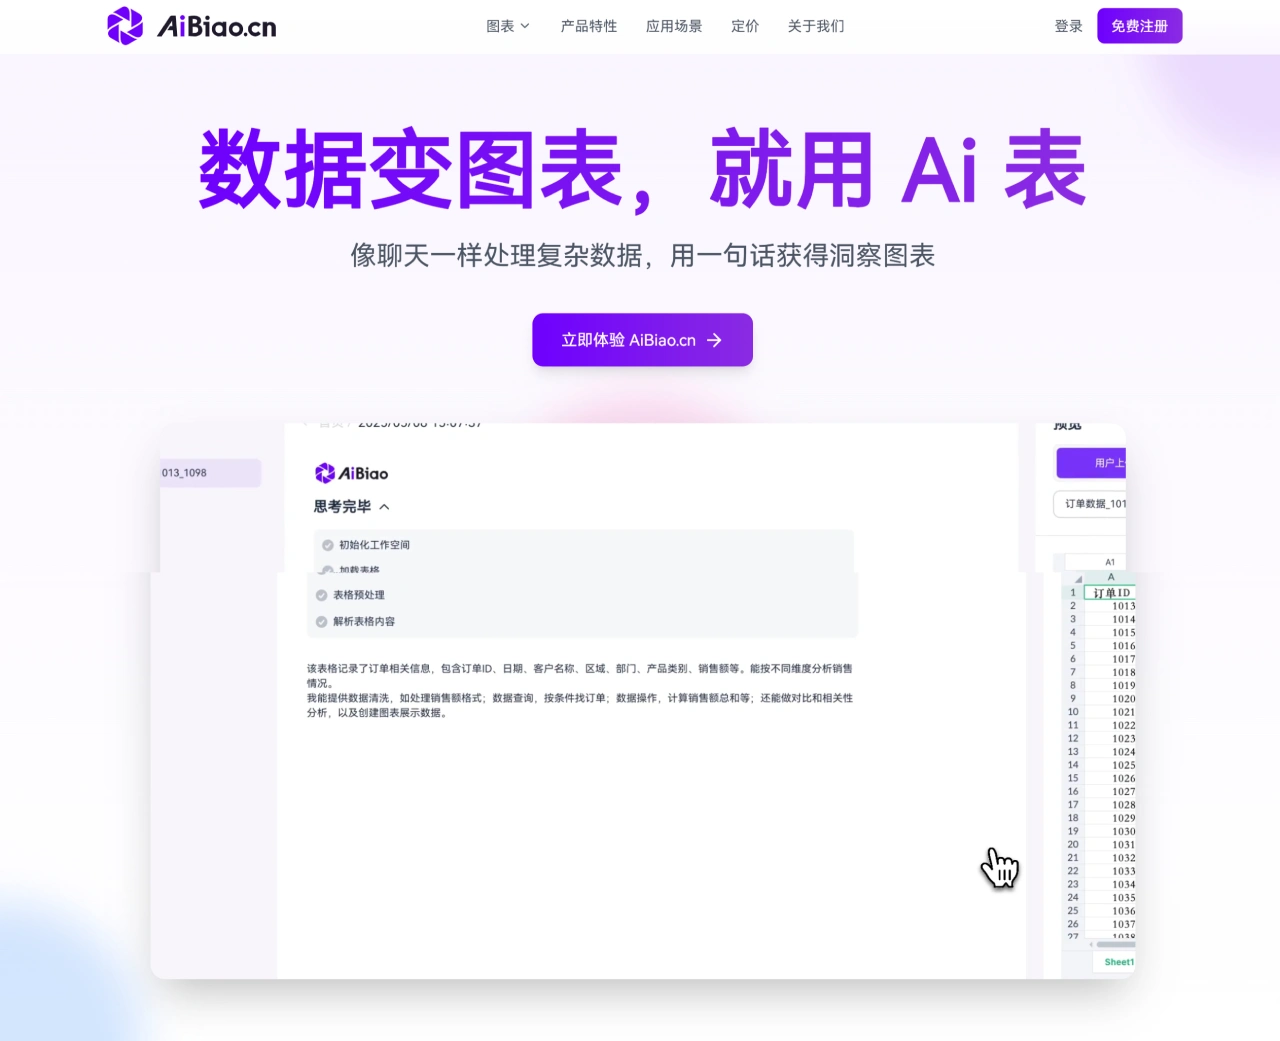
Core Features
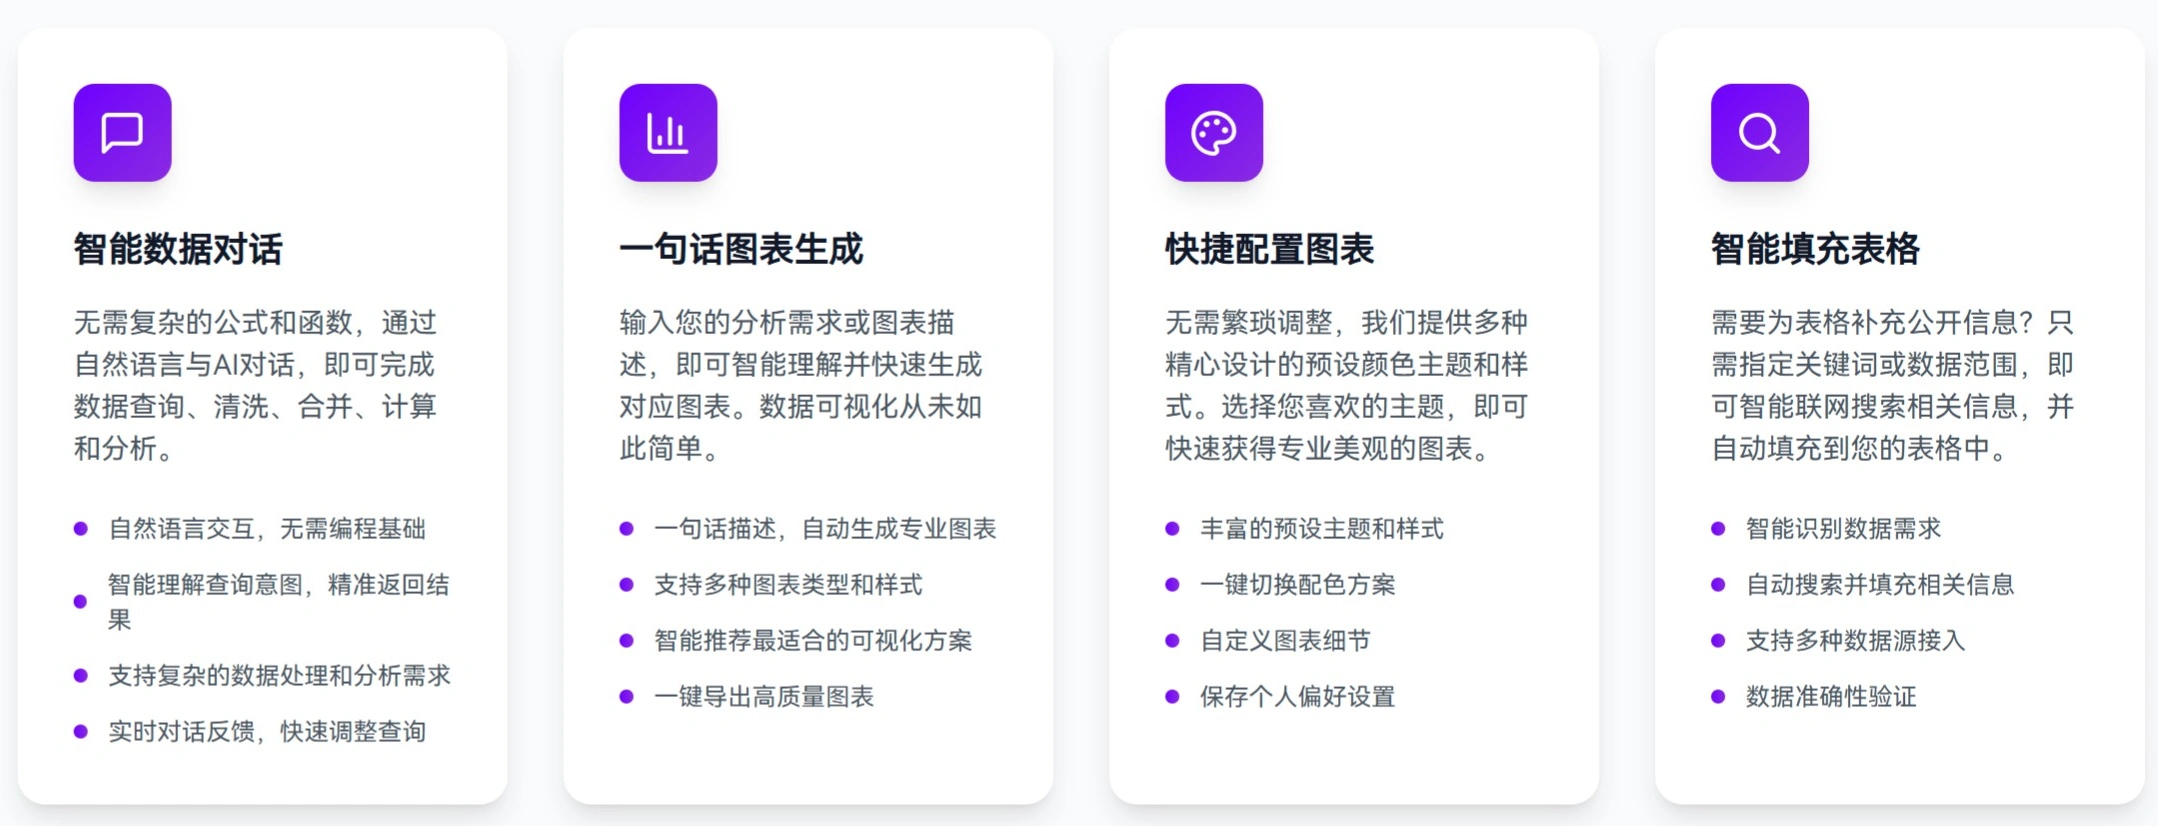
Intelligent Data Conversation: Complete data querying, cleaning, merging, calculation, and analysis through natural language conversations without complex formulas and functions.
Natural language interaction, no programming foundation required
Intelligently understands query intent and accurately returns results
Supports complex data processing and analysis needs
Real-time conversational feedback for quick query adjustments
One-Sentence Chart Generation: Input analysis needs or chart descriptions to quickly generate corresponding charts, supporting multiple types and styles, with one-click export of high-quality charts.
Describe in one sentence, automatically generate professional charts
Supports multiple chart types and styles
Intelligently recommends the most suitable visualization solutions
One-click export of high-quality charts
Chart Template Plaza: Features a massive collection of professional chart templates covering multiple scenarios, with one-click template application and quick data replacement.
Covers marketing, finance, human resources, and other scenarios
Carefully crafted by professional designers
One-click template application and quick data replacement
Continuously updated to keep up with trends
Comprehensive Chart Configuration: Provides rich preset themes and color schemes, supporting customization of colors, fonts, labels, layouts, and more.
Rich preset themes and color schemes, one-click application
Online editor with real-time preview, WYSIWYG
Supports comprehensive customization of colors, fonts, labels, layouts, and more
Save personalized themes for easy team reuse
Intelligent Table Filling: Automatically searches and fills in relevant information, supporting multiple data source integrations.
Intelligently identifies data needs
Automatically searches and fills in relevant information
Supports multiple data source integrations
Data accuracy verification
Ai表 Applicable Fields
E-commerce Operations: Generate charts through AI conversations and analyze trends with one click.
Finance: Intelligently reconcile accounts and automatically generate analysis.
Human Resources: Generate talent profiles with one click and intelligently analyze trends.
Education and Research: Intelligently process data and generate paper charts with one click.
Healthcare: Quickly analyze medical records and intelligently generate reports.
Government Agencies: Intelligently integrate data and generate analysis reports with one click.
Marketing: Integrate multi-source data and intelligently generate insights.
Retail Chains: Unify data analysis and intelligently predict demand.
How to Use Ai表
Log in and upload data files.
Issue data processing instructions in natural language in the conversation area, and AI provides real-time feedback.
Input chart descriptions, and AI automatically generates charts, supporting type and style adjustments.
Select templates from the template plaza, apply with one click, and replace data.
Use the online editor to modify chart details and save personalized themes.
Specify keywords or data ranges, and AI will search the web and populate table information.
One-click export of generated high-quality charts.
Ai表 Key Questions
Q: Among the core features of Ai表, which ones help users reduce the need for professional skills?
A: The intelligent data conversation and one-sentence chart generation features eliminate the need for complex formulas and professional chart-making skills.
Q: Across different applicable fields, what is the highest efficiency improvement percentage for Ai表, and which field does it involve?
A: The highest efficiency improvement is 80%, involving the finance and education and research fields.
Q: In user feedback, which positions mentioned Ai表's help with data integration or unified analysis?
A: The Retail Chain Operations Director, Senior Analyst, and Market Research Director mentioned relevant assistance.