Script Planner Assistant▸
 AI Apps
 AI News

AI Graph Maker: Free AI Chart Generator for Interactive Visuals
AI Graph Maker: Free AI Chart Generator for Interactive VisualsIntroduction
ai Graph Maker is a free chart generation tool that supports multiple chart types and can quickly transform data into intuitive visual charts. It is suitable for both professionals and beginners, and can be used for data analysis, report creation, project management, and more.
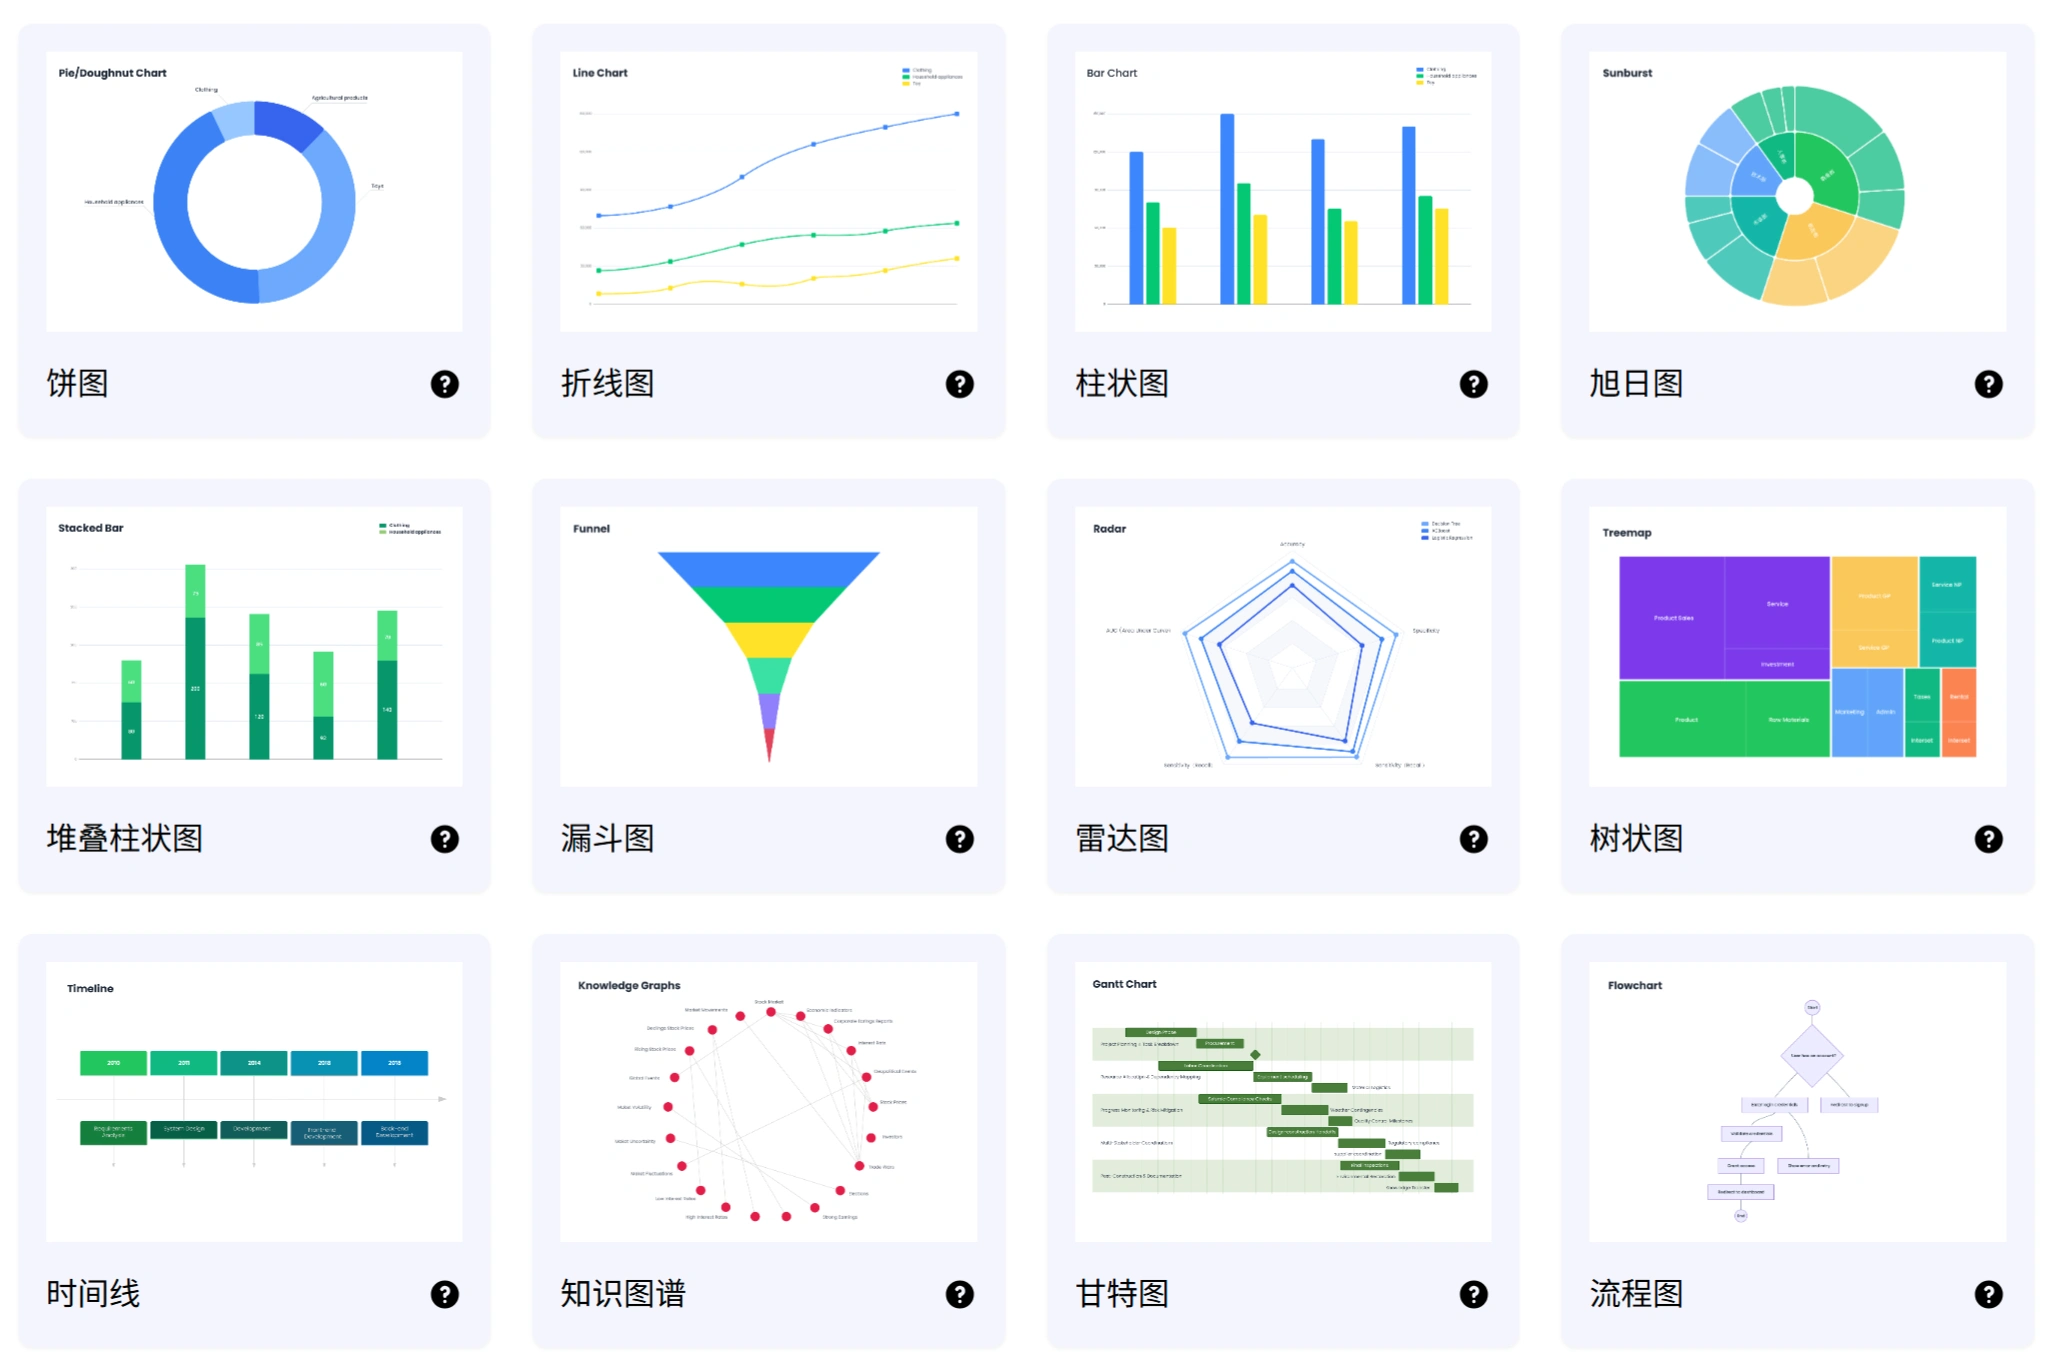
Supported Chart Types
Basic statistical charts: bar charts (including stacked bar charts), pie charts, line charts, scatter plots, radar charts, etc., used for data comparison, proportion display, trend analysis, and more.
Process and structure charts: flowcharts, Gantt charts, timelines, ER diagrams, tree diagrams, organizational charts, pyramid charts, etc., suitable for process mapping, project planning, and hierarchical relationship display.
Professional visualization charts: sunburst charts, funnel charts, Sankey diagrams, knowledge graphs, C4 diagrams, mind maps, etc.
Core Features
Smart generation: automatically recommends appropriate chart types based on data type, quickly completing data visualization.
Flexible editing: customize chart colors, fonts, labels, titles, and other styles; charts update in real time after data modifications.
Multi-format export: supports export to PNG, SVG, Mermaid, and other formats for easy cross-platform use.
Responsive design: adapts to multiple devices, ensuring a consistent experience across various scenarios.
Usage Steps
Enter data: input your organized data into the tool;
Select chart type: manually choose or let AI recommend a suitable type;
Generate chart: click the "Generate" button to create;
Edit and adjust: customize colors, fonts, labels, and other styles; modifications to data update in real time;
Export and share: download in PNG, SVG, or other formats, or share directly.
Applicable Scenarios
Market analysis, financial reports, demographics, etc. (pie charts, bar charts, line charts);
Project progress tracking, task planning (Gantt charts, timelines);
Process optimization, conversion rate analysis (funnel charts, Sankey diagrams);
Knowledge organization, brainstorming (mind maps, knowledge graphs);
Software architecture design, hierarchical relationship display (C4 diagrams, tree diagrams, organizational charts), etc.
FAQ
Customization: supports modifying data content and chart styles, with real-time updates.
Chart type selection: AI recommends based on data type; users can also manually switch.
Data modification: edit the data table directly and click "Update"; AI automatically regenerates the chart.
Technical support: get help via email at [email protected].
Highlights & Advantages
Free to use with no specialized skills required, lowering the barrier to data visualization;
Rich variety of chart types to meet diverse needs;
AI-driven efficiency, reducing manual design and adjustment time;
Strong cross-platform compatibility, supporting sharing and further editing across scenarios.