Script Planner Assistant▸
 AI Apps
 AI News

AI-Kline: A-Share Technical Analysis and AI Prediction Tool
AI-Kline: A-Share Technical Analysis and AI Prediction ToolIntroduction
aiWhat is AI K-Line?
AI K-Line (AI-Kline) is an AI-powered stock analysis and prediction framework that combines candlestick (K-line) charts, technical indicators, financial data, and news data to perform in-depth analysis of the stock market. It is not limited to traditional K-line chart analysis; it also integrates multiple data sources, including technical indicators, financial data, and news data, to provide more comprehensive stock analysis and forecasting.
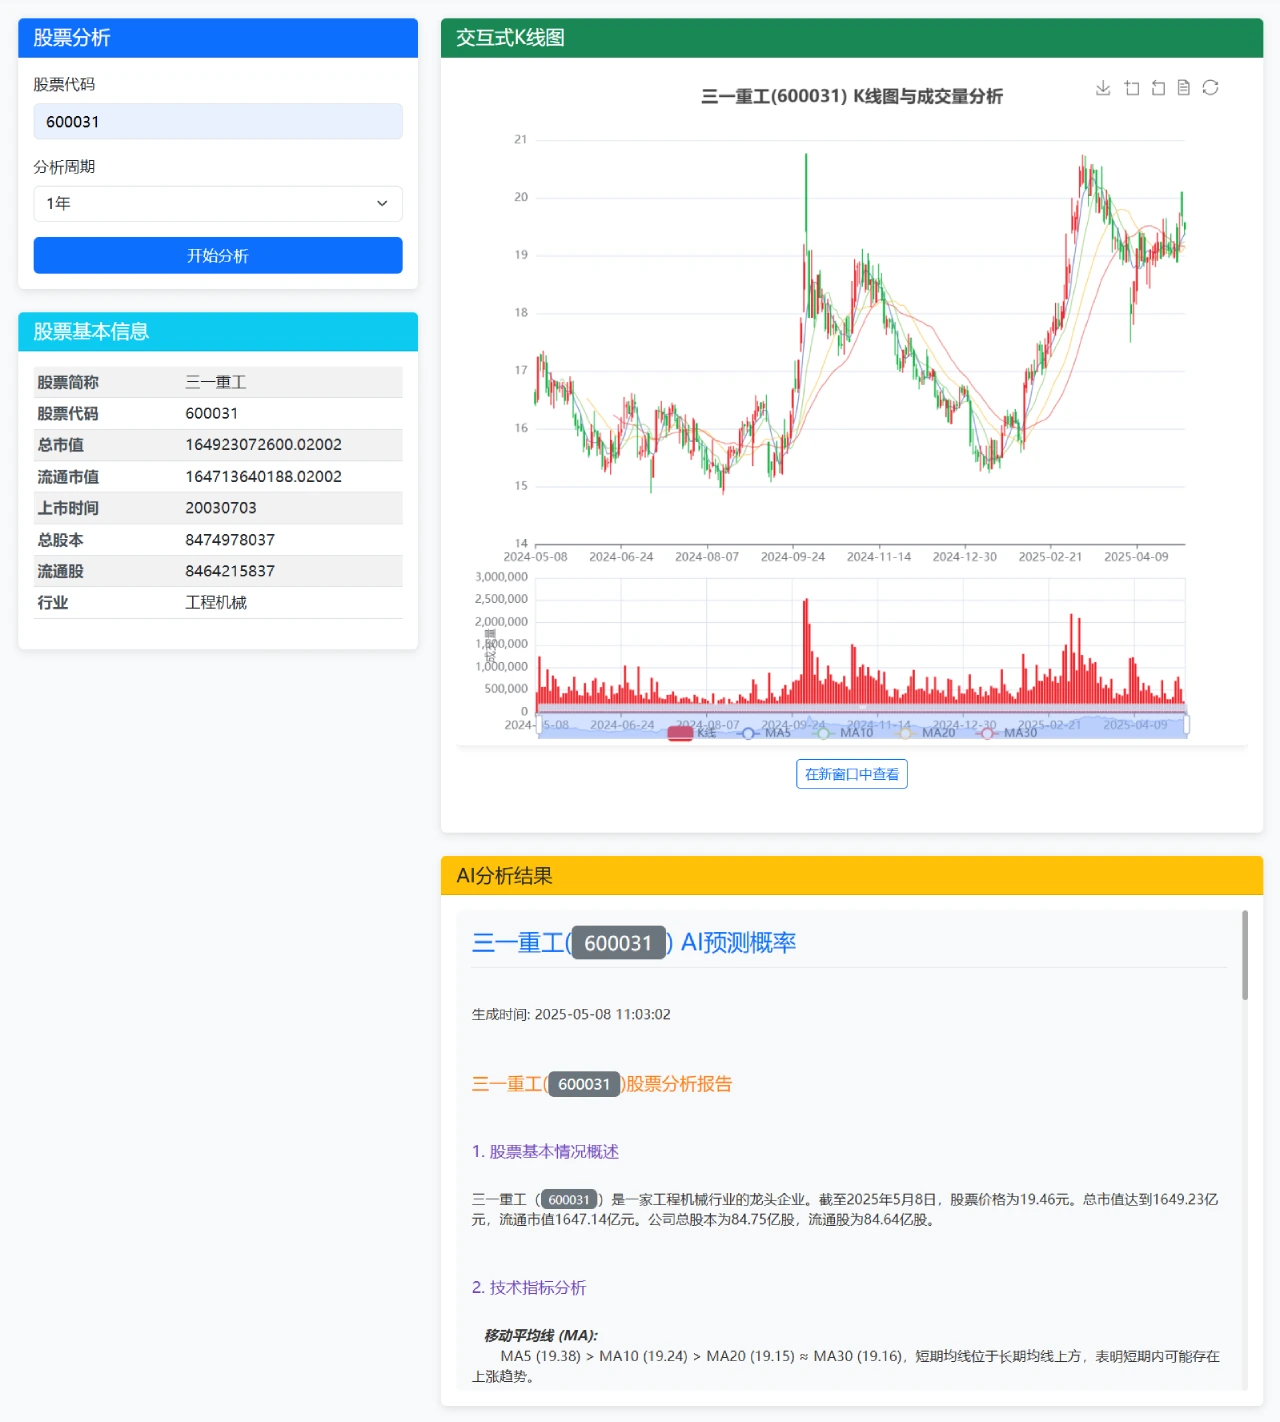
What Can AI K-Line Do?
Retrieve historical price and volume data for A-share stocks and calculate various technical indicators
Generate professional K-line charts and technical indicator visualizations
Obtain financial data and news information related to stocks
Use Google's Gemini AI model to analyze integrated data and predict future stock trends
Main Features of AI K-Line
Data Retrieval: Uses AKShare to obtain historical trading data, financial data, and news information for A-share stocks.
Technical Analysis: Calculates multiple technical indicators, including MA, MACD, KDJ, RSI, Bollinger Bands, and more.
Visualization: Generates static and interactive K-line charts as well as technical indicator charts.
AI Analysis: Leverages Google's Gemini AI model to analyze stock data and predict future trends.
Technical Implementation of AI K-Line
Data Processing: The project needs to integrate and process multiple data sources, including K-line chart data, technical indicators, financial data, and news data. The data processing module is responsible for cleaning, transforming, and storing the data.
Model Training: Uses machine learning and deep learning algorithms to train on the processed data and build prediction models. The project may use time series models such as LSTM and GRU, as well as other classification and regression models.
Visualization Display: The project provides an intuitive visualization interface that displays stock price trends, technical indicators, financial data, and prediction results. Users can intuitively understand the analysis outcomes through charts and reports.
Use Cases of AI K-Line
Individual Investors: Helps individual investors perform stock analysis and forecasting, providing decision support.
Institutional Investors: Provides institutional investors with more comprehensive data analysis and prediction tools, improving the accuracy of investment decisions.
Research Institutions: Offers financial research institutions a platform for data analysis and model validation, supporting academic research and market analysis.