Script Planner Assistant▸
 AI Apps
 AI News

ShuKuaJing BI: Essential Online Self-Service Data Analysis Tool for Cross-Border E-Commerce Sellers
ShuKuaJing BI: Essential Online Self-Service Data Analysis Tool for Cross-Border E-Commerce SellersIntroduction
What is ShukuaJing BI?
ShukuaJing BI is an online self-service data analysis tool designed specifically for cross-border e-commerce sellers. It can effectively integrate data from multiple cross-border e-commerce platforms (such as Amazon, Shopee, Lazada, etc.), independent sites (such as Shopify, ShoplaZa, etc.), and advertising platforms. It breaks through the limitations of traditional Excel and ERP systems, providing one-stop self-service analysis functions, covering various scenarios such as product selection, supply chain, advertising and marketing, sales and traffic analysis, and financial profit accounting.
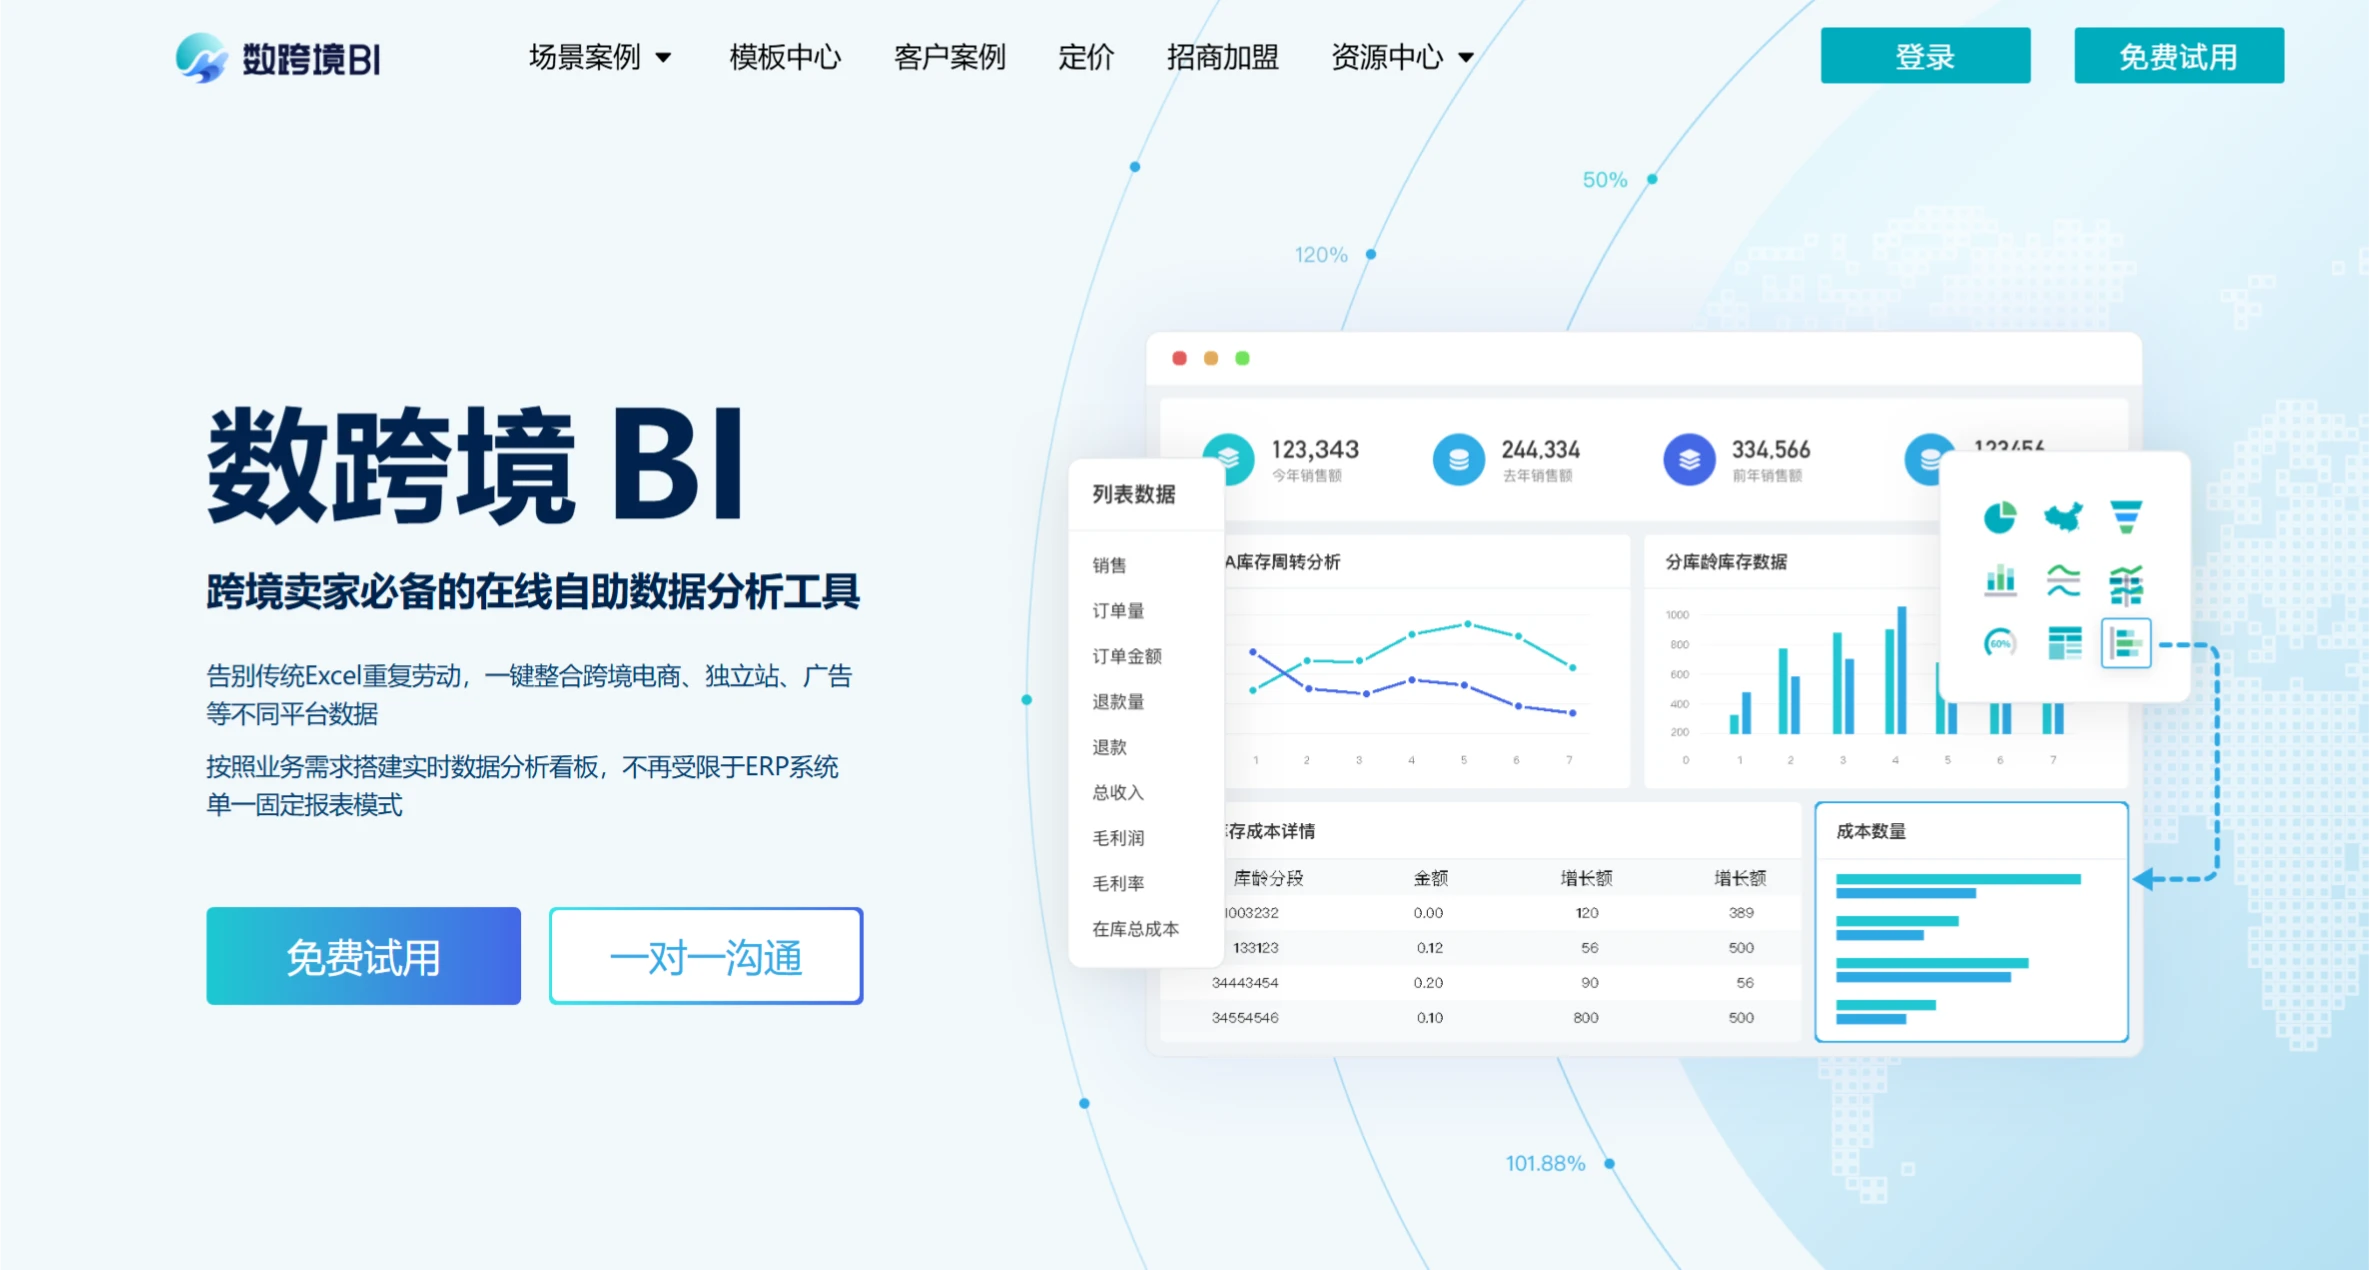
ShukuaJing BI Function Modules
Data Integration: It can integrate data from different platforms such as cross-border e-commerce (Amazon, Shopee, Lazada, etc.), independent sites (ShoplaZa, Shopify, etc.), and advertising platforms with one click, breaking data silos.
Rich Analysis Scenarios
Product Selection and Listing Optimization: Perform broad keyword searches to view keyword trend changes, reverse-check ASIN keyword rankings, and optimize product listings based on word frequency statistics.
Supply Chain Analysis: View inventory quantity, value, cost and other data across multiple dimensions; customize calculations for sales volume over time periods such as the last 3/7/14/30/60/90 days; and customize coefficients to calculate parameters such as safety stock and warning stock levels. For example, in FBA inventory turnover analysis, the sellable inventory quantity is 3,977, the total in-stock cost is 166,715, and the total in-transit cost is 50,175.
Advertising Marketing Analysis: Track trends in key metrics such as CTR, CPC, ACOS, ROI; view advertising placement results across multiple dimensions; customize advertising targets or spending budgets and monitor in real time. For example, an ad has different impression volumes in different months from January to May 2023, which can be used to analyze placement effectiveness.
Sales and Traffic Analysis: Conduct conversion funnel analysis from impression to order; analyze period-over-period and year-over-year changes in key metrics; support custom multi-level performance targets and monitor completion rates in real time. For example, monthly sales volume is 1266, with a month-over-month increase of 69.39% and year-over-year of 0.00%; monthly sales amount is 83,819.62 yuan, etc.
Financial Profit Accounting: Full coverage of revenue, cost, expenses, taxes, and profit; supports refined profit calculation at multiple granularities (store, team, product, etc.); report item logic can be entered once and reused infinitely.
Target Users of ShukuaJing BI
Functions for Management Personnel
Real-Time Business Data Dashboard: Provides real-time monitoring of overall business operations, helping management make quick decisions.
Drill-Down Sales Analysis by Platform, Store, and Category: Analyzes sales data by different platforms, stores, and categories, facilitating timely strategic adjustments.
Real-Time Data Sharing Across Multiple Teams, Accounts, and Clients: Supports data sharing among teams, reducing communication costs.
Enterprise Data Center: Implements row-level data control, ensuring enterprise information security.
Functions for Operations Personnel
API Data Integration: Integrates data from different platforms and stores through API interfaces, breaking data silos.
Visual Charts and Business Data Dashboards: Provides visual charts and real-time updated business data dashboards, making data more intuitive and easier to understand.
Personalized In-Depth Analysis: Allows operations personnel to perform in-depth data analysis based on business needs, without being limited to fixed analysis functions.
Functions for Finance Personnel
Multi-Dimensional Financial Analysis: Analyzes store sales volume, profit, cost, and expense composition from multiple dimensions, helping finance personnel gain a clearer understanding of business operations.
Data Dashboard: Displays various financial indicators through a single data dashboard with real-time updates, enabling finance personnel to grasp business trends.
Saved Analysis Templates: Supports saving analysis templates with real-time updates to the original data tables, enabling intelligent financial operations.
Frequently Asked Questions
Q: Compared with traditional Excel data analysis, what are the main advantages of ShukuaJing BI?
A: ShukuaJing BI integrates multi-platform data with one click, breaking data silos, whereas Excel requires manual integration and is inefficient. ShukuaJing BI allows building real-time data analysis dashboards based on business needs, no longer limited to fixed report templates, while creating charts in Excel is complex. ShukuaJing BI can automatically sync data and reuse analysis templates, whereas Excel suffers from analysis lag and repetitive work issues.
Q: What key metric trends can ShukuaJing BI track?
A: ShukuaJing BI can track trends in key metrics such as CTR (Click-Through Rate), CPC (Cost Per Click), ACOS (Advertising Cost of Sales), and ROI (Return on Investment). By viewing advertising placement results across multiple dimensions (site, date, ad type, etc.), it helps sellers better evaluate ad effectiveness and optimize advertising strategies.
Q: What traditional financial analysis challenges can ShukuaJing BI solve for finance personnel?
A: Traditional financial analysis requires manually downloading backend financial reports and repeatedly creating spreadsheets to calculate profits, which is inefficient. ShukuaJing BI can obtain order data from multiple platforms and stores in real time, reducing the burden of data collection. It can analyze store sales volume, profit, cost and expense composition, and break-even points across multiple dimensions, with all financial indicators visible in a single data dashboard, helping finance personnel understand business trends. At the same time, by saving analysis templates and updating original tables in real time, intelligent financial operations can be achieved, avoiding repetitive spreadsheet work.