Script Planner Assistant▸
 AI Apps
 AI News

Dycharts
DychartsIntroduction
Dycharts, an interactive chart-making tool accessible to everyone. Simply input your data to generate charts with one click. Powered by AI GC capabilities, it makes it easy to create interactive charts, data reports, PPTs, videos, big screens, and more.
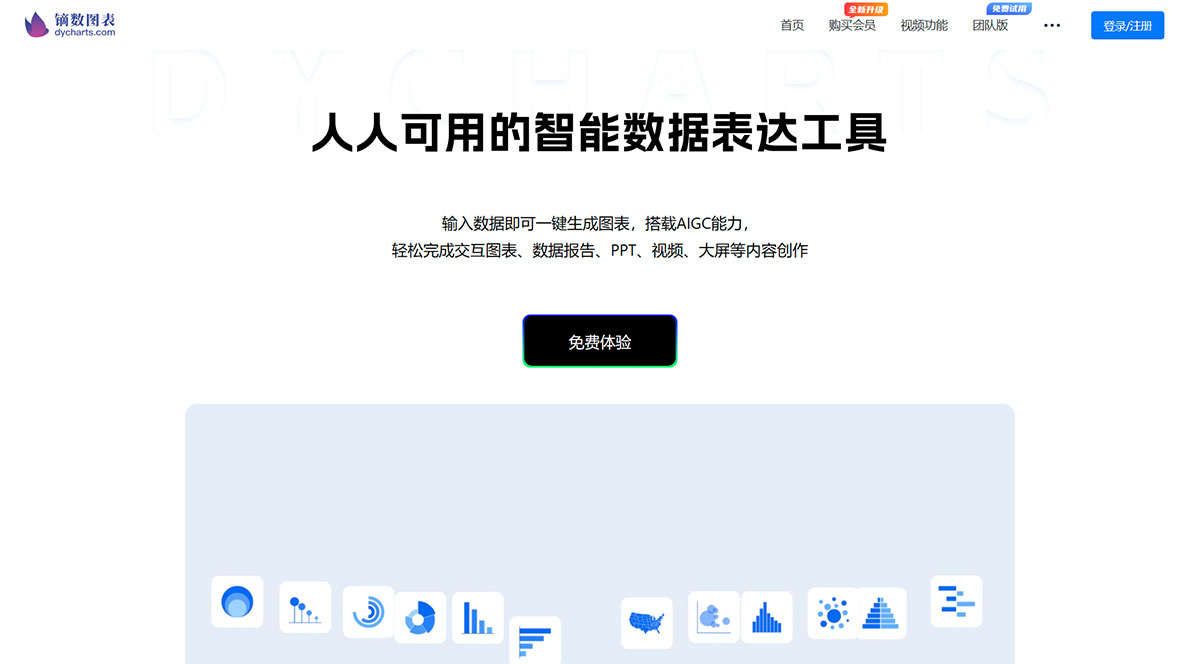
Dycharts is a powerful free online data visualization tool. Simply input your data to generate visualization videos and interactive web charts with one click, including data animations, vector charts, and infographics. It supports nearly 100 chart types such as word clouds, Sankey diagrams, rose charts, river charts, and radar charts. With thousands of visualization templates available, content creation, media operations, marketing posters, market research, academic paper writing, work summaries, personal resumes, and more can all be easily handled on Dycharts.
Dycharts Features:
Data Charts: Import your data to generate charts with one click. Includes 150+ chart types such as word clouds, Sankey diagrams, and maps. Supports chart animations and interactions, with a rich variety of dynamic effects and detailed configuration options to achieve beautiful and personalized data expressions.
Data Dashboard: No coding required. Create data dashboards in 3 minutes. Zero code and zero barriers, with templates available for all industries. Data association ensures timeliness and synchronized updates, and multi-format exports meet different use scenarios.
Infographics: A massive library of templates. Just modify the data to instantly generate visuals. Covers full-scenario templates including infographics, long images, posters, resumes, and PPTs. Supports dynamic interactive displays, provides multi-industry data dimension references, and helps you express data efficiently.
Data Videos: No need to switch platforms. Create viral data short videos. From data upload to chart creation, from smart narration to video export, with built-in dynamic backgrounds and diverse elements, it offers a one-stop solution for data video creation across different needs.
Easily create multi-form industry reports—smarter and more intelligent. Rich industry templates support material uploads and resource sharing. AI-powered data analysis quickly outputs multi-form reports, making creative data expression smarter.
Dycharts (dycharts.com) is a powerful online data visualization tool independently developed by Dycharts Tech. It provides over 140 chart templates and massive scenario-based infographic templates for more than 400 million users worldwide, meeting the creation, presentation, and sharing needs of data professionals across all industries for advanced charts, dynamic charts, interactive charts, and data reports.