Script Planner Assistant▸
 AI Apps
 AI News

Lucidchart – A Powerful Online Diagramming and Visualization Tool
Lucidchart – A Powerful Online Diagramming and Visualization ToolIntroduction
Lucidchart is an online diagramming and visualization tool developed by Lucid Software. It supports multiple diagram types, allowing users to create flowcharts, organizational charts, mind maps, UML, ERD, BPMN, wireframes, network diagrams, and more. It also provides real-time collaboration features, enabling team members to edit the same document simultaneously.
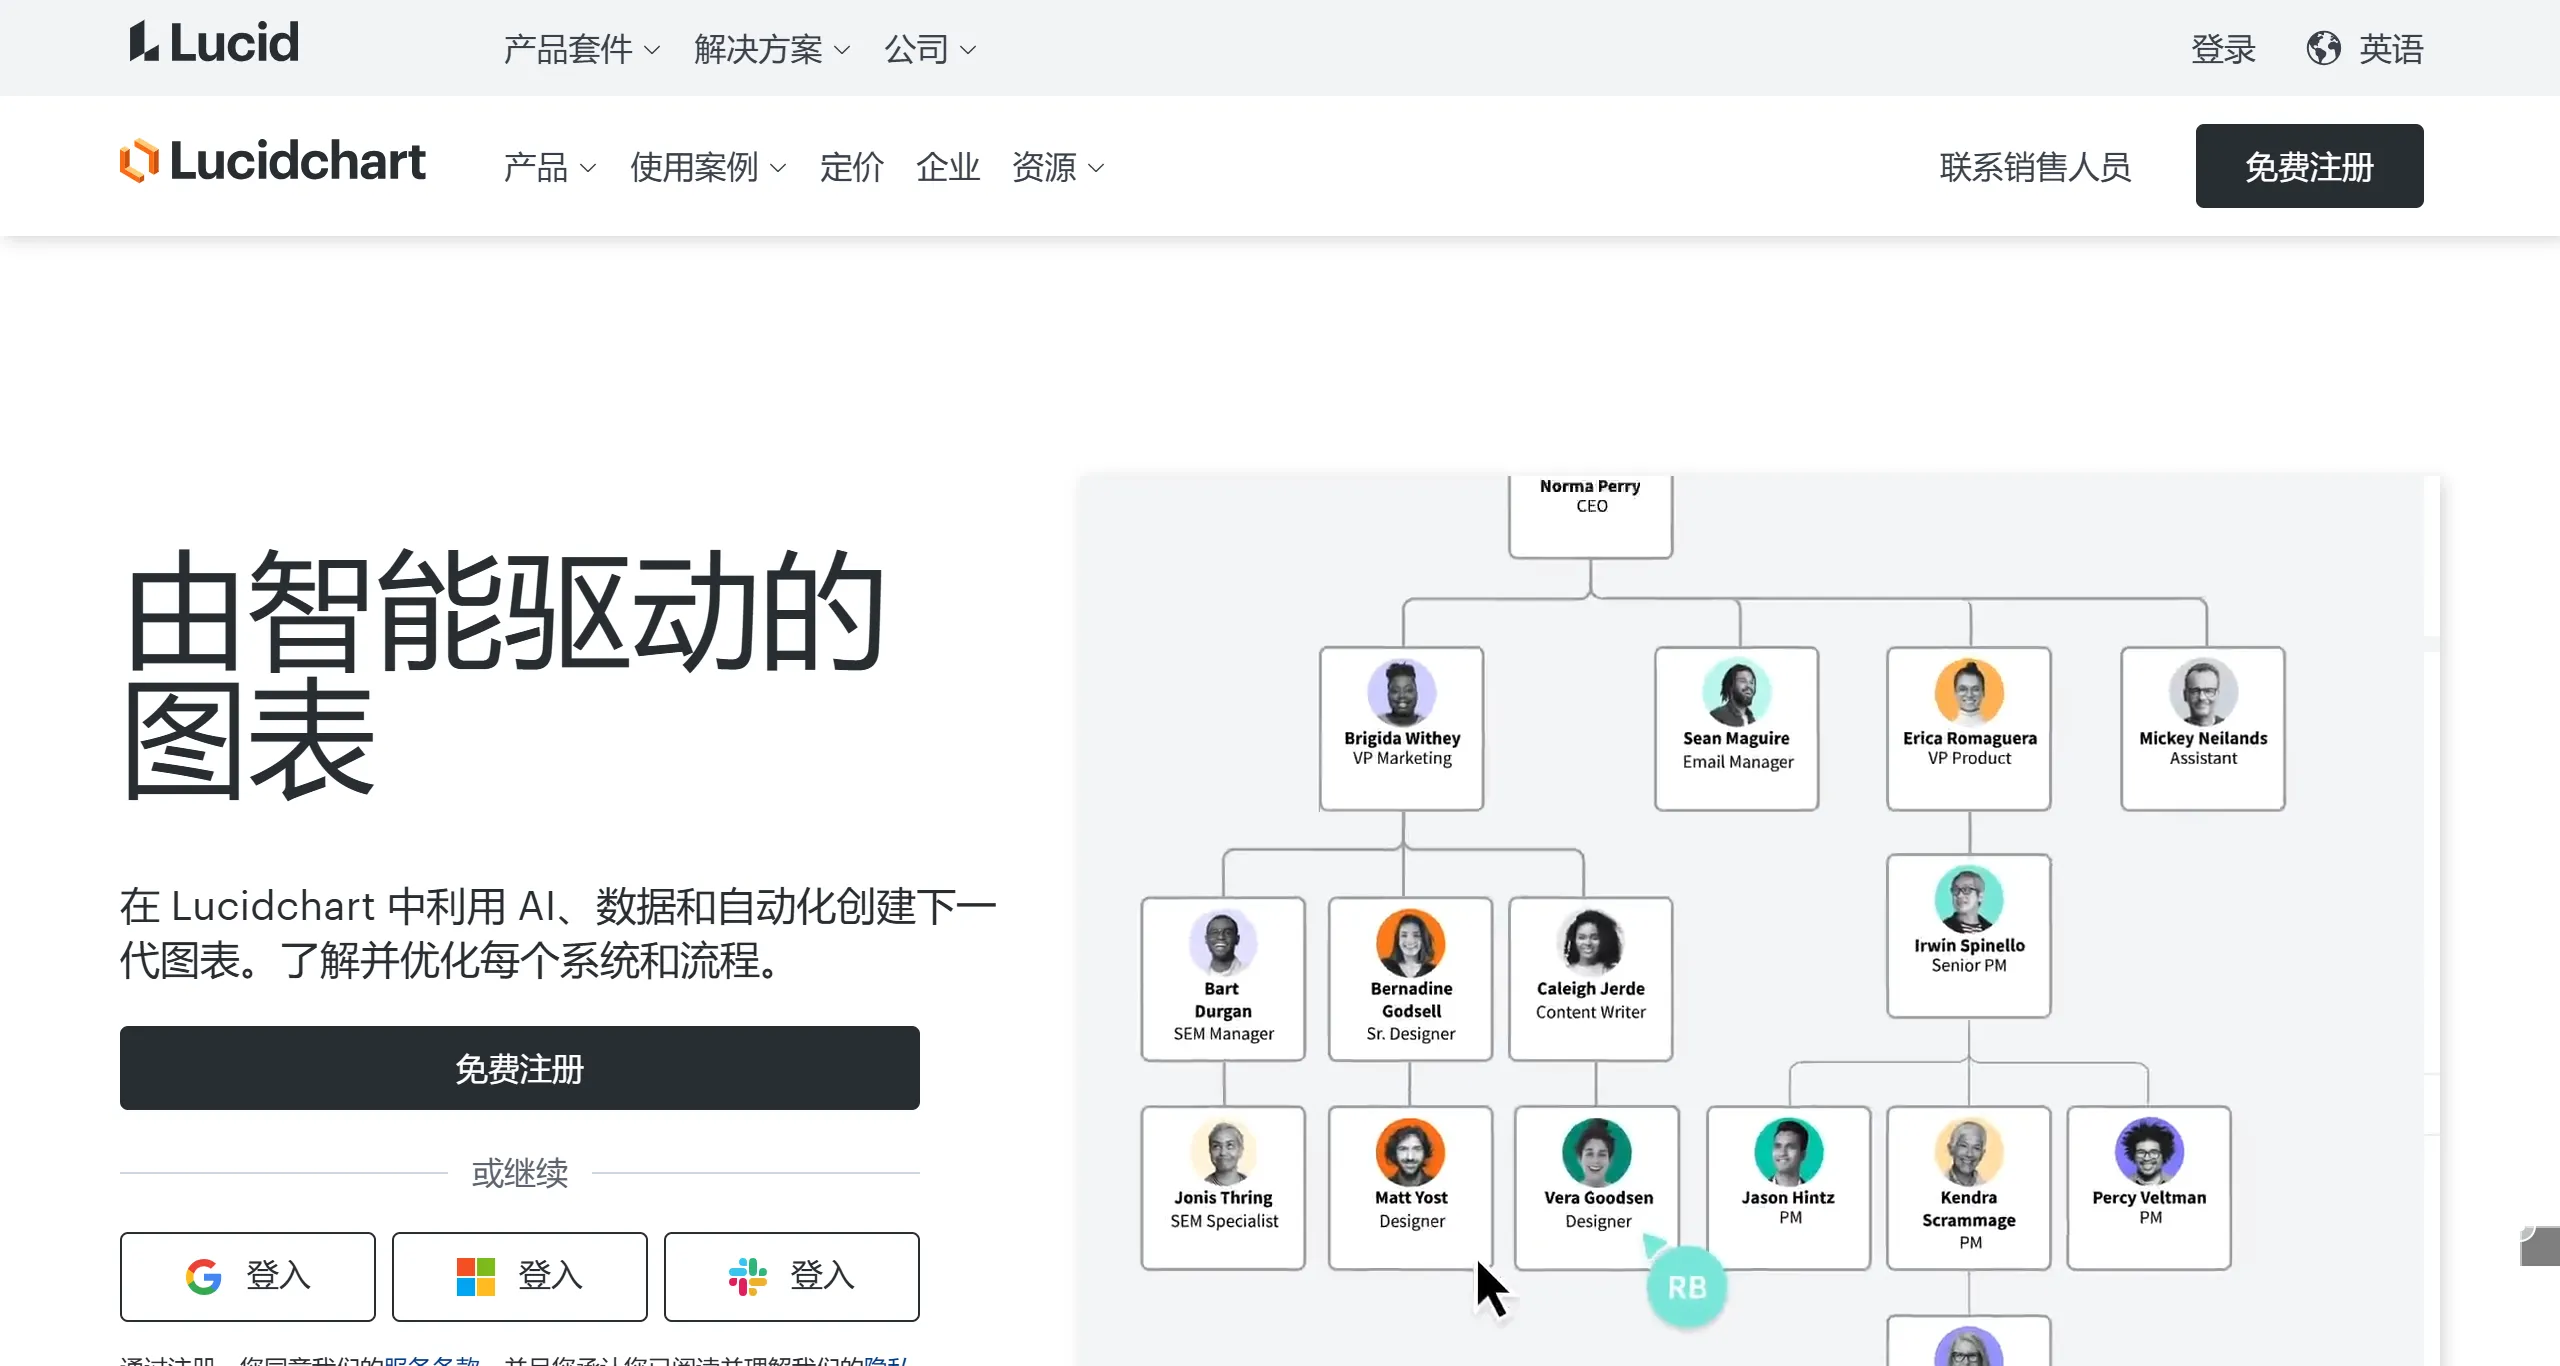
Lucidchart Core Features:
Multi-type Diagram Support: Lucidchart supports flowcharts, organizational charts, mind maps, network diagrams, UML diagrams, and many other diagram types to meet the needs of different fields.
Templates and Shape Library: Offers a large number of preset templates and shape libraries, including import and export of Visio, OmniGraffle, and Gliffy files, making it easy to kick off projects quickly.
Smart Diagramming: Lucidchart provides a variety of templates and shapes, allowing users to quickly create professional diagrams.
Real-time Collaboration: Supports real-time co-editing by team members, who can work on the same document at the same time, view changes in real time, and improve collaboration efficiency.
Data Integration: Users can import data into diagrams to automatically generate visualizations, helping to better understand the data.
Multi-platform Support: Lucidchart is available on the web, desktop, and mobile devices, making it convenient for users to create and edit diagrams anytime, anywhere.
Enterprise-grade Security: Provides SSO and SAML authentication, as well as automatic account provisioning, suitable for enterprise-level applications.
Compatibility and Export: Runs in all major browsers, integrates with tools like Google Drive and Slack, and supports export in multiple formats, including PDF, PNG, JPG, and Visio.

Lucidchart Use Cases:
Academic Research: For example, in the paper "An ISO-certified genomics workflow for identification and surveillance of antimicrobial resistance", Lucidchart was used to reproduce complex genomics workflow diagrams, clearly illustrating the research process.
Office Documents: When creating business process diagrams, product design prototypes, or IT network architecture diagrams, Lucidchart's online collaboration features are particularly useful.
Education: Teachers can create teaching support materials, while students can use it to organize their thoughts and plan projects.
Lucidchart Versions:
Free Version: Provides basic features, suitable for simple personal use.
Personal, Team, and Enterprise Versions: As the version upgrades, more advanced features are offered, such as more storage space, advanced collaboration tools, and enterprise-grade security controls, suitable for team and enterprise needs.
Lucidchart Applications:
In academic publications, authors use Lucidchart to reproduce complex scientific processes, improving the readability and professionalism of their papers.
Within enterprises, Lucidchart is used to draw organizational structures, plan project processes, and create UML diagrams in software development, facilitating communication and understanding among teams.
Steps to Create a Flowchart in Lucidchart:
Sign Up and Log In: Visit the Lucidchart official website, register an account, or log in.
Choose a Template: On the main interface, select "New Document", then choose a suitable flowchart template from the template library. Lucidchart provides a variety of preset templates to help you get started quickly.
Add Shapes: Use the shapes and arrows in the left toolbar and drag them onto the canvas. You can choose different shapes to represent different steps, such as rectangles for operations and diamonds for decision points.
Connect Shapes: Use connector lines to link different shapes, representing the sequence and relationships of the process. Lucidchart provides a smart connection feature that automatically recognizes and connects shapes.
Add Text: Double-click a shape to add text describing the specific content of each step. Keep the text concise and clear for easy understanding.
Customize Styles: You can beautify the flowchart by adjusting colors, line styles, and fonts to make it more readable and appealing.
Save and Export: When finished, click the "File" menu and select "Export" to save the flowchart in multiple formats, such as PDF, PNG, etc.
With its powerful features and compatibility, Lucidchart has become the go-to tool for diagramming across industries. Whether for academic research, enterprise project management, or daily office work, Lucidchart can meet your needs.