Script Planner Assistant▸
 AI Apps
 AI News

Hiplot: Biomedical Data Analysis & Visualization Tool
Hiplot: Biomedical Data Analysis & Visualization ToolIntroduction
Hiplot is an online data processing and visualization tool that offers immediate analysis of complex medical data, transforming it into intuitive and easy-to-understand charts. It helps doctors quickly capture key information behind the data to make more scientific and personalized medical decisions. It serves as a powerful assistant for improving work efficiency, deepening understanding of conditions, aiding precise diagnosis, and optimizing treatment plans.
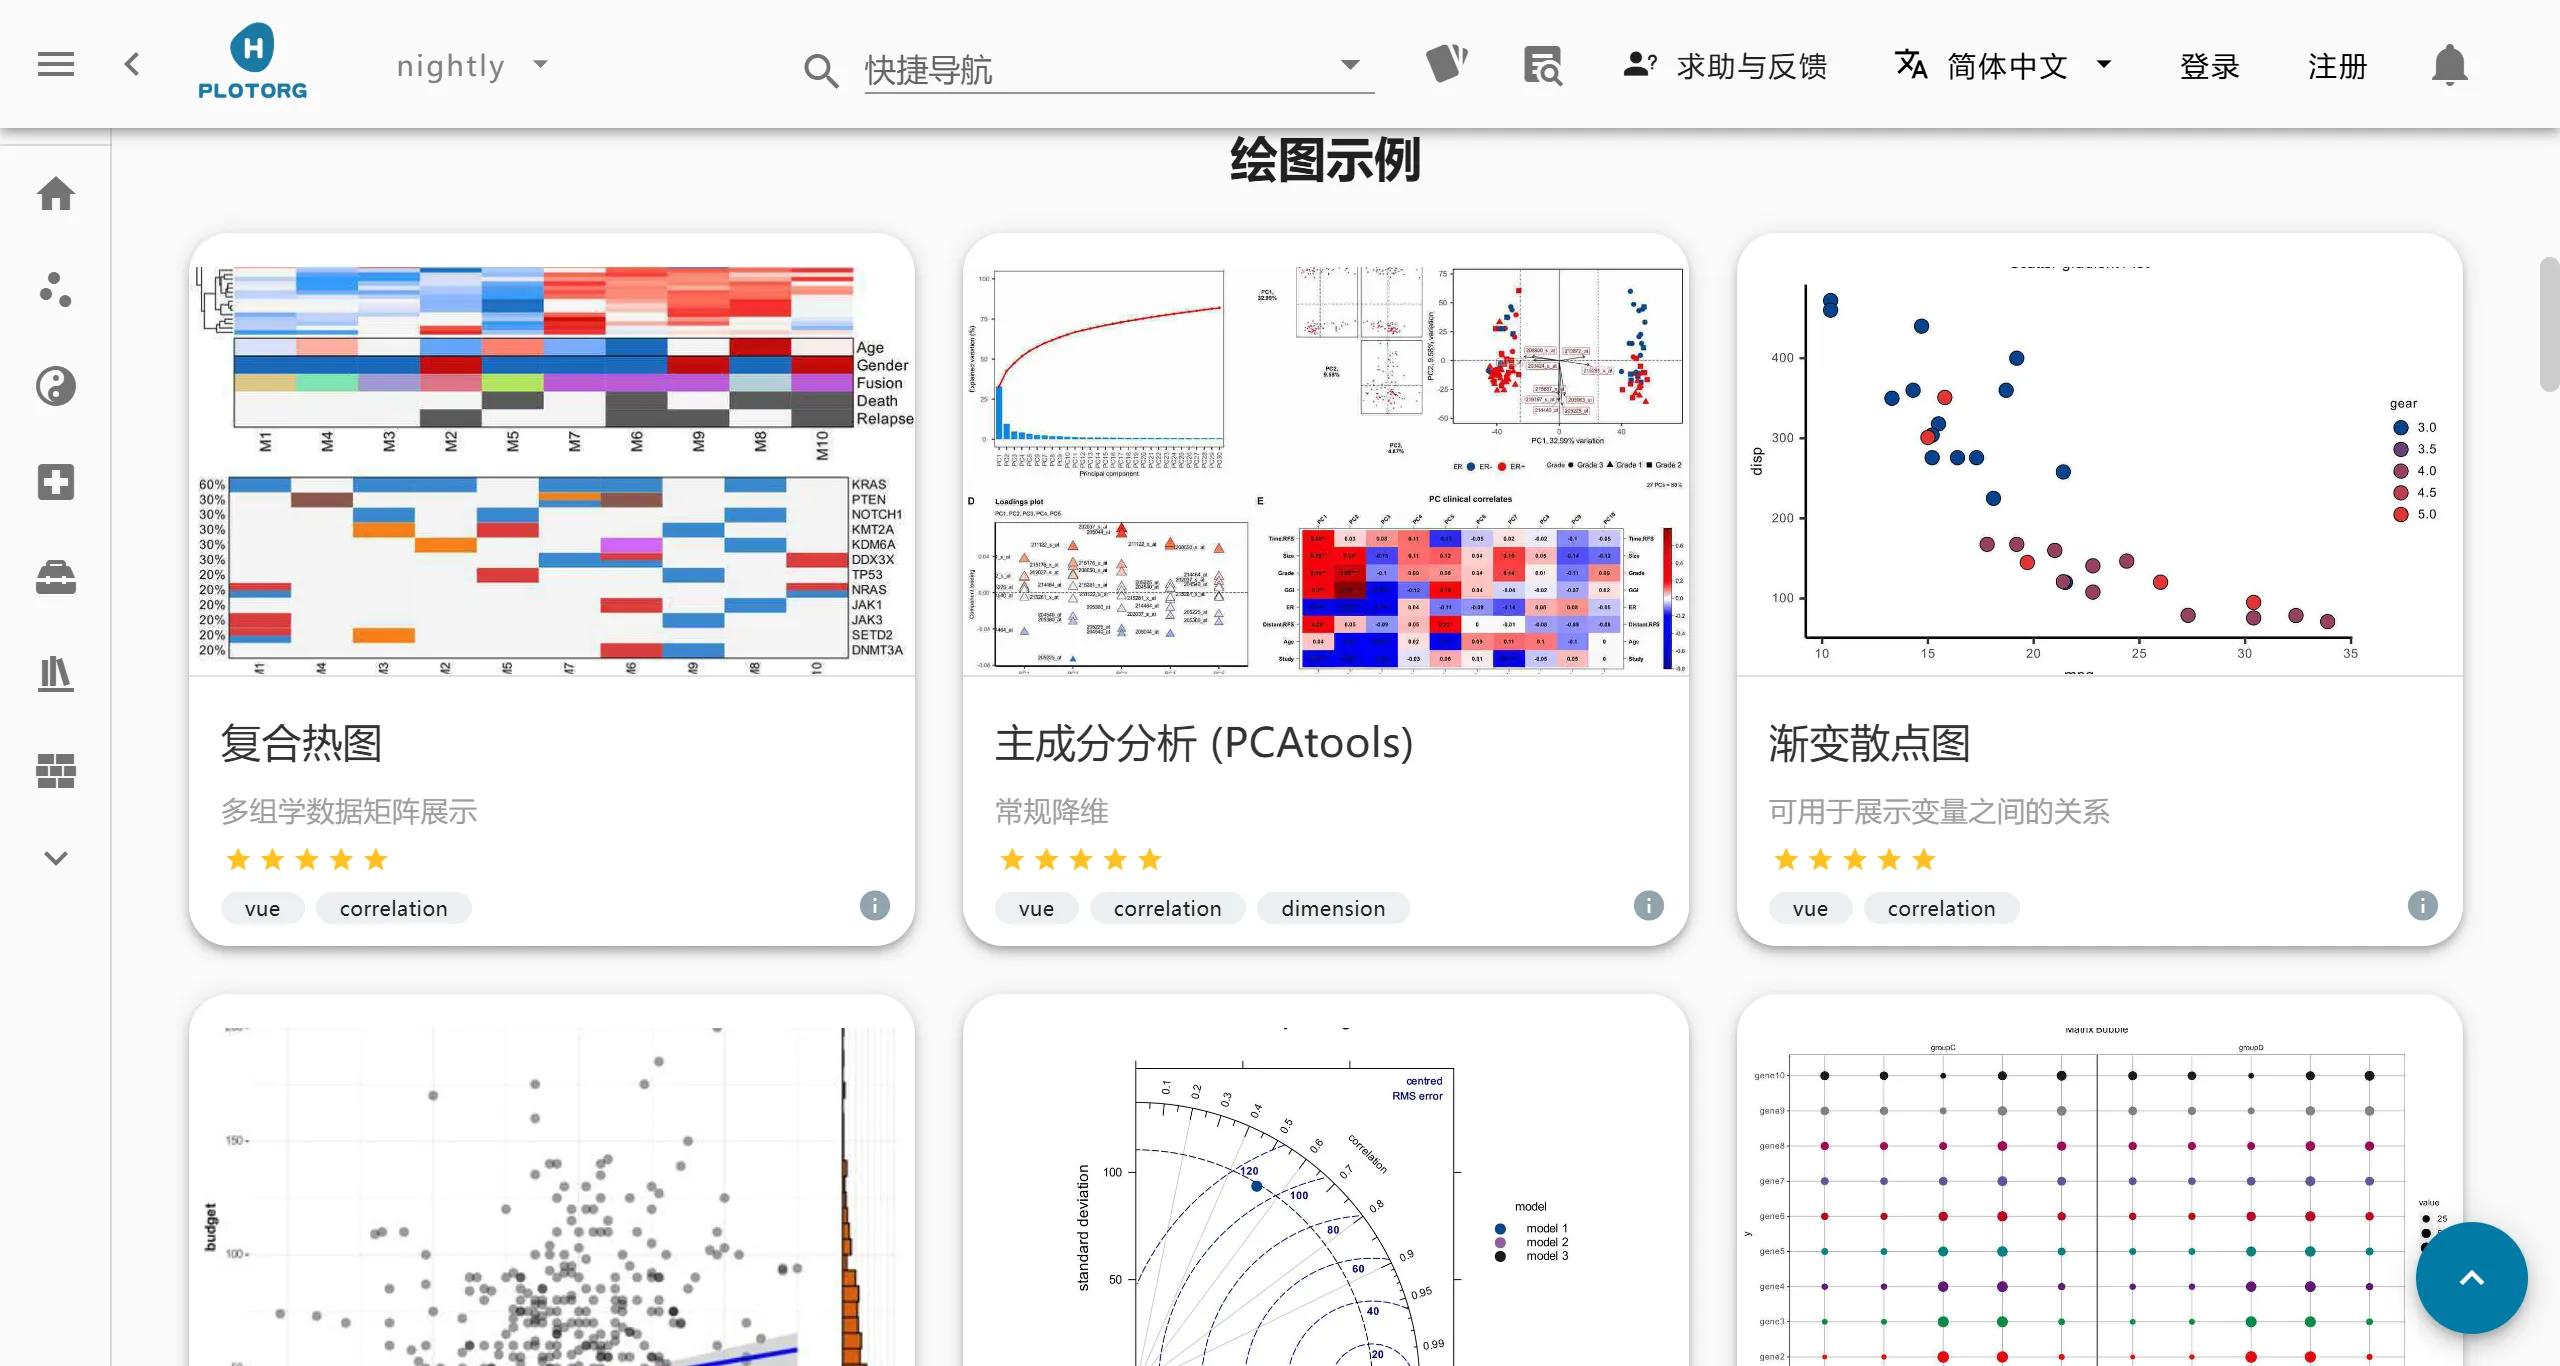
Hiplot Features
Multi-dimensional Data Visualization: Hiplot provides various visualization options such as parallel coordinate plots and scatter plots, suitable for displaying and analyzing high-dimensional datasets.
Interactive Exploration: Users can interactively explore data through operations such as dragging and zooming to discover patterns and correlations in the data.
Support for Multiple Data Formats: Hiplot supports various data formats including JSON, CSV, and Pandas DataFrame, making it convenient for users to import and analyze data.
Hiplot Functions:
Plotting Tools: Provides various plotting functions including heatmaps, principal component analysis, and matrix bubble plots to meet different scientific research drawing needs.
Data Analysis: Supports online BLAST, SRA data download, GO/KEGG enrichment analysis, etc., helping users perform multi-omics data analysis and text mining.
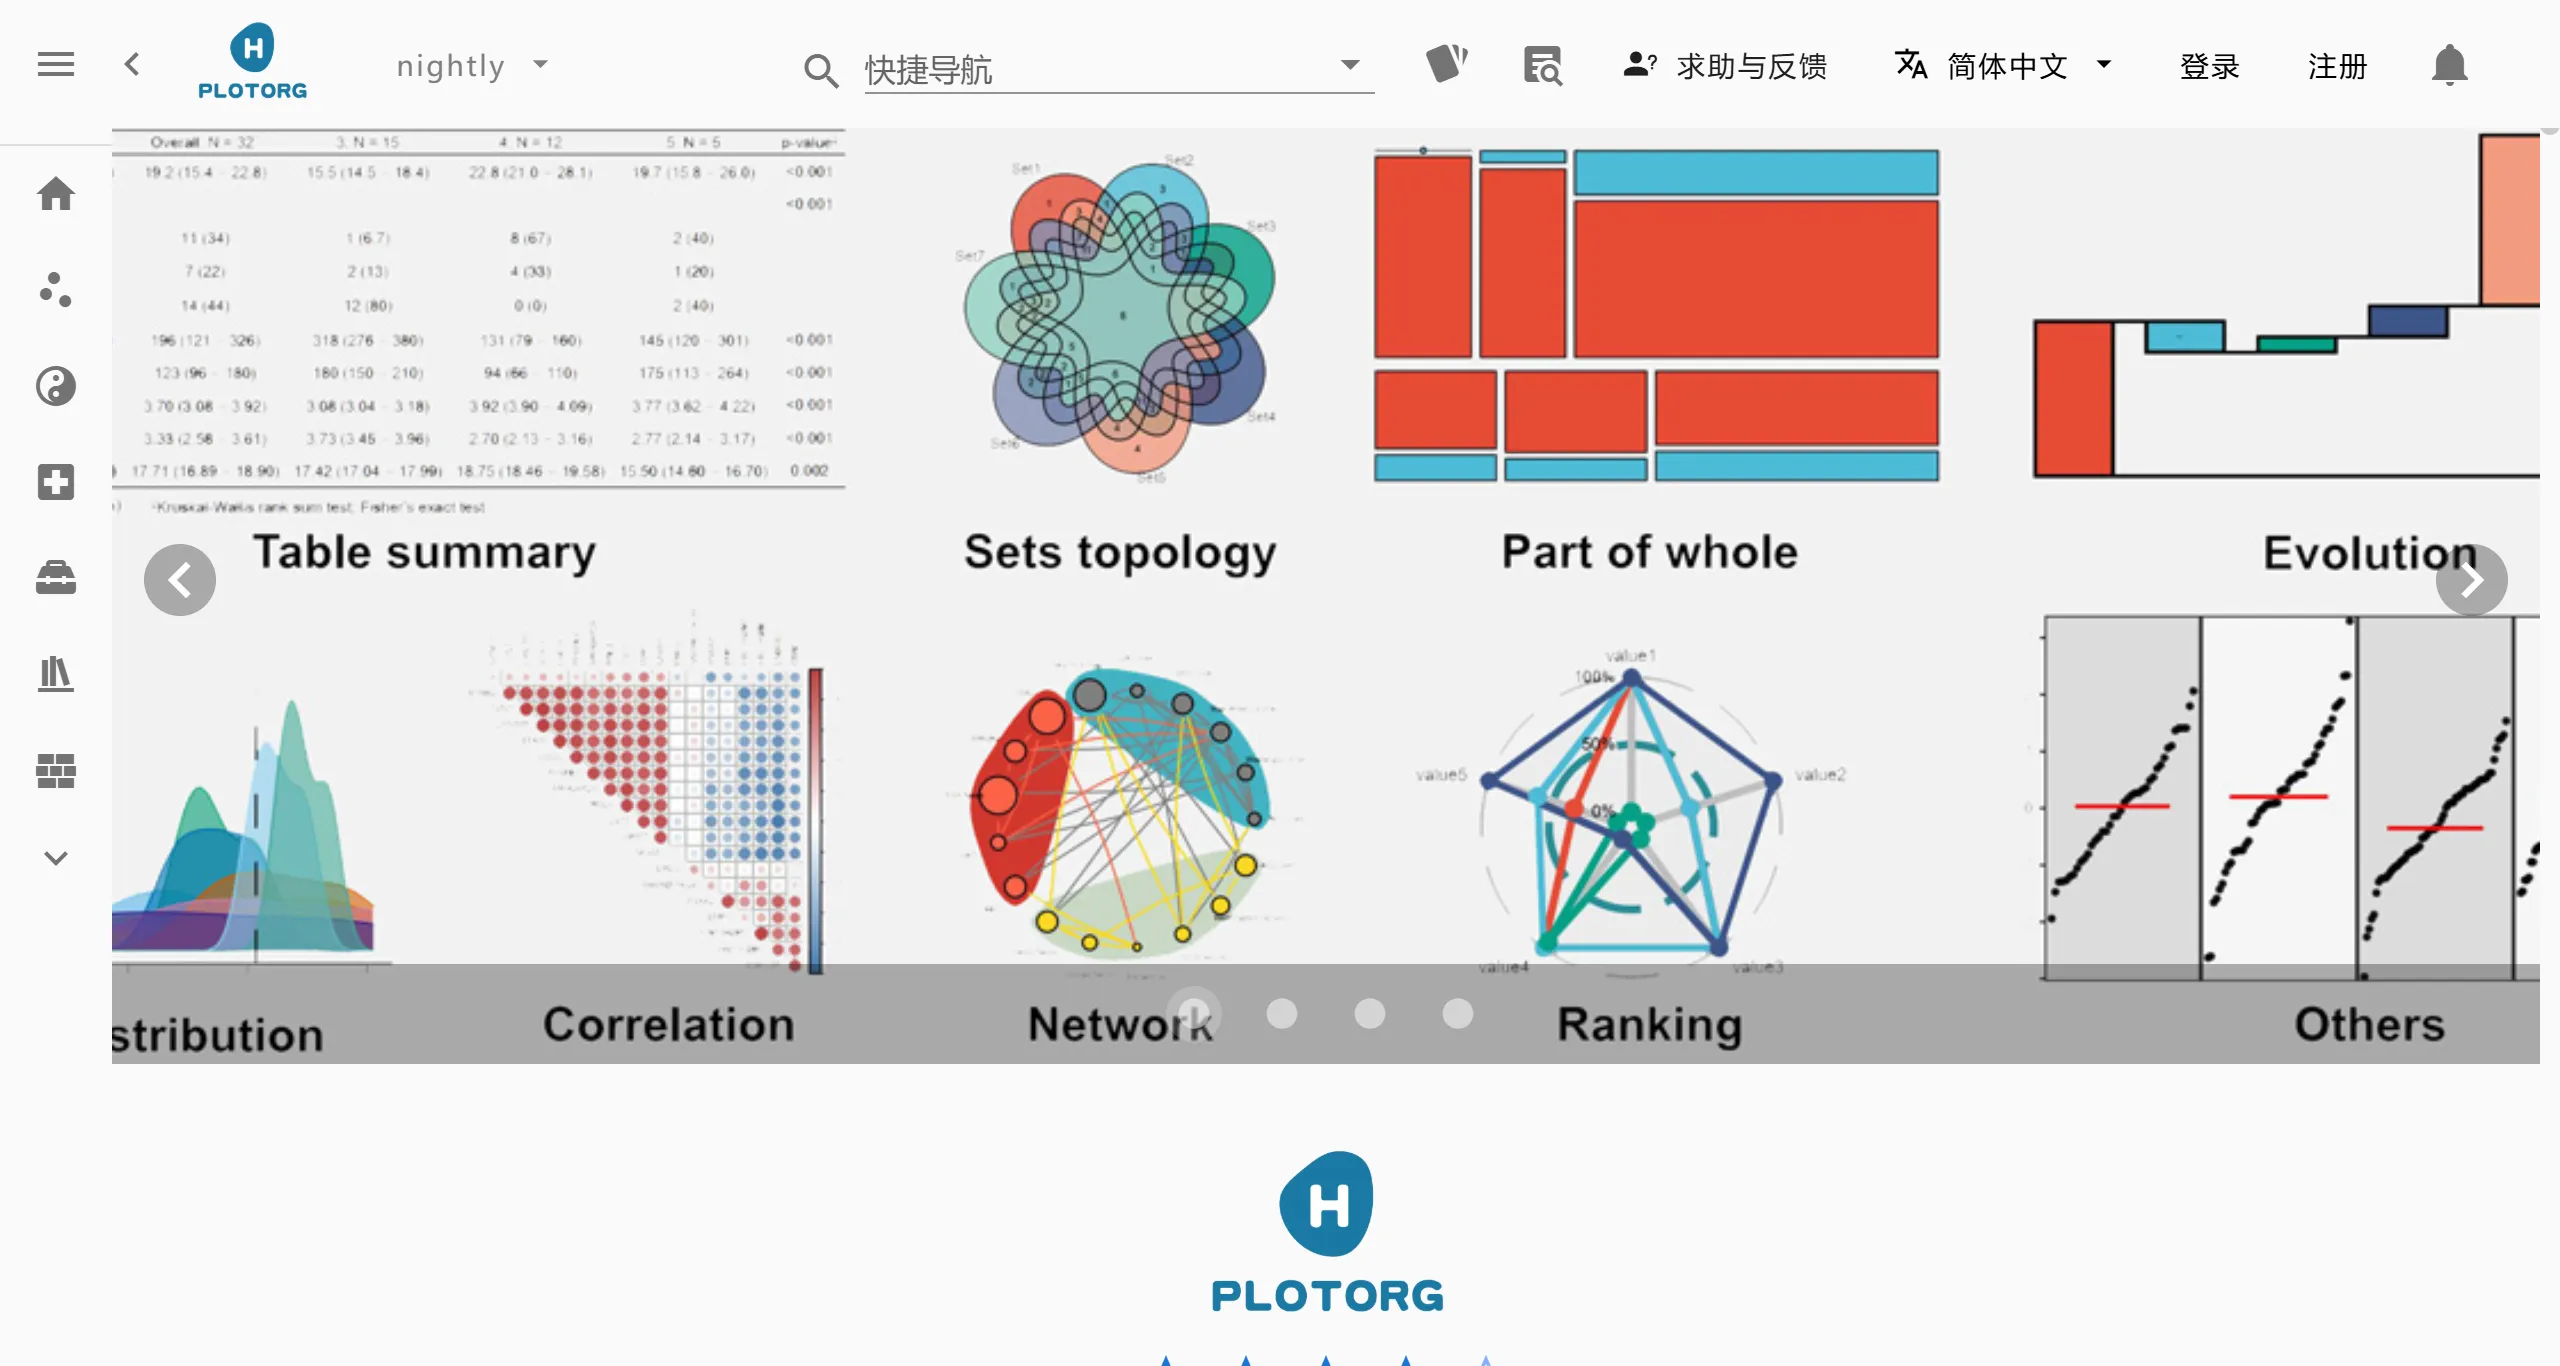
Hiplot Modules:
Basic Statistics: Users can perform basic data analysis and visualization.
Regression Analysis: Supports visualization of multiple regression models.
Cluster Analysis: Helps users identify patterns and groups in the data.
Genomics and Transcriptomics: Visualization tools specifically designed for biomedical data.
Hiplot User Groups:
Hiplot's users mainly include clinicians, researchers, and data analysts. Hiplot is applicable to various research scenarios, especially in the biomedical field. The Hiplot platform helps users quickly discover patterns and trends in data by providing easy-to-understand data visualization tools, enhancing research efficiency and results presentation.
AI Research: Helps AI researchers analyze patterns and correlations in high-dimensional data.
Biomedicine: Used for visualization of biomedical data, supporting various analysis functions.
Data Science: Applicable to data exploration and visualization in various data science projects.
Education: Serves as a teaching tool to help students understand data visualization techniques.
Research and Development: Supports researchers in quickly validating data models during the development process.
How to Use Hiplot?
1. Register and Login: First, register an account on the Hiplot platform.
2. Upload Data: Hiplot supports multiple data formats. Users can choose to upload experimental data in formats such as Excel spreadsheets or CSV files according to actual needs. After uploading, Hiplot will automatically parse the data and generate default graphical displays based on the data type, providing users with preliminary visualization results.
3. Edit Graphics: Hiplot provides rich graphic editing options. Users can adjust parameters such as legends, axis labels, and colors to achieve graphic effects that better match personal aesthetics and academic requirements. After editing, users can preview graphical changes in real time.
4. Save Graphics: Edited graphics can be directly saved as common image formats (such as PNG, JPEG) or downloaded as data files. In addition, Hiplot supports online sharing of graphics, generating share links for graphics to facilitate sharing research results with colleagues, mentors, or team members.
Hiplot is a free online plotting platform developed by Shanghai Tengyun Biotechnology Co., Ltd., focusing on bioinformatics data analysis and visualization. Hiplot was officially launched in September 2020, offering various data analysis and plotting tools, supporting interactive exploration of high-dimensional data, and is widely used in scientific research and clinical data analysis. Hiplot aims to build a rapidly iterating scientific data visualization platform and collaborative community that supports both Chinese and English environments.