Script Planner Assistant▸
 AI Apps
 AI News

VisDoc: A Powerful AI Text-to-Diagram Tool
VisDoc: A Powerful AI Text-to-Diagram ToolIntroduction
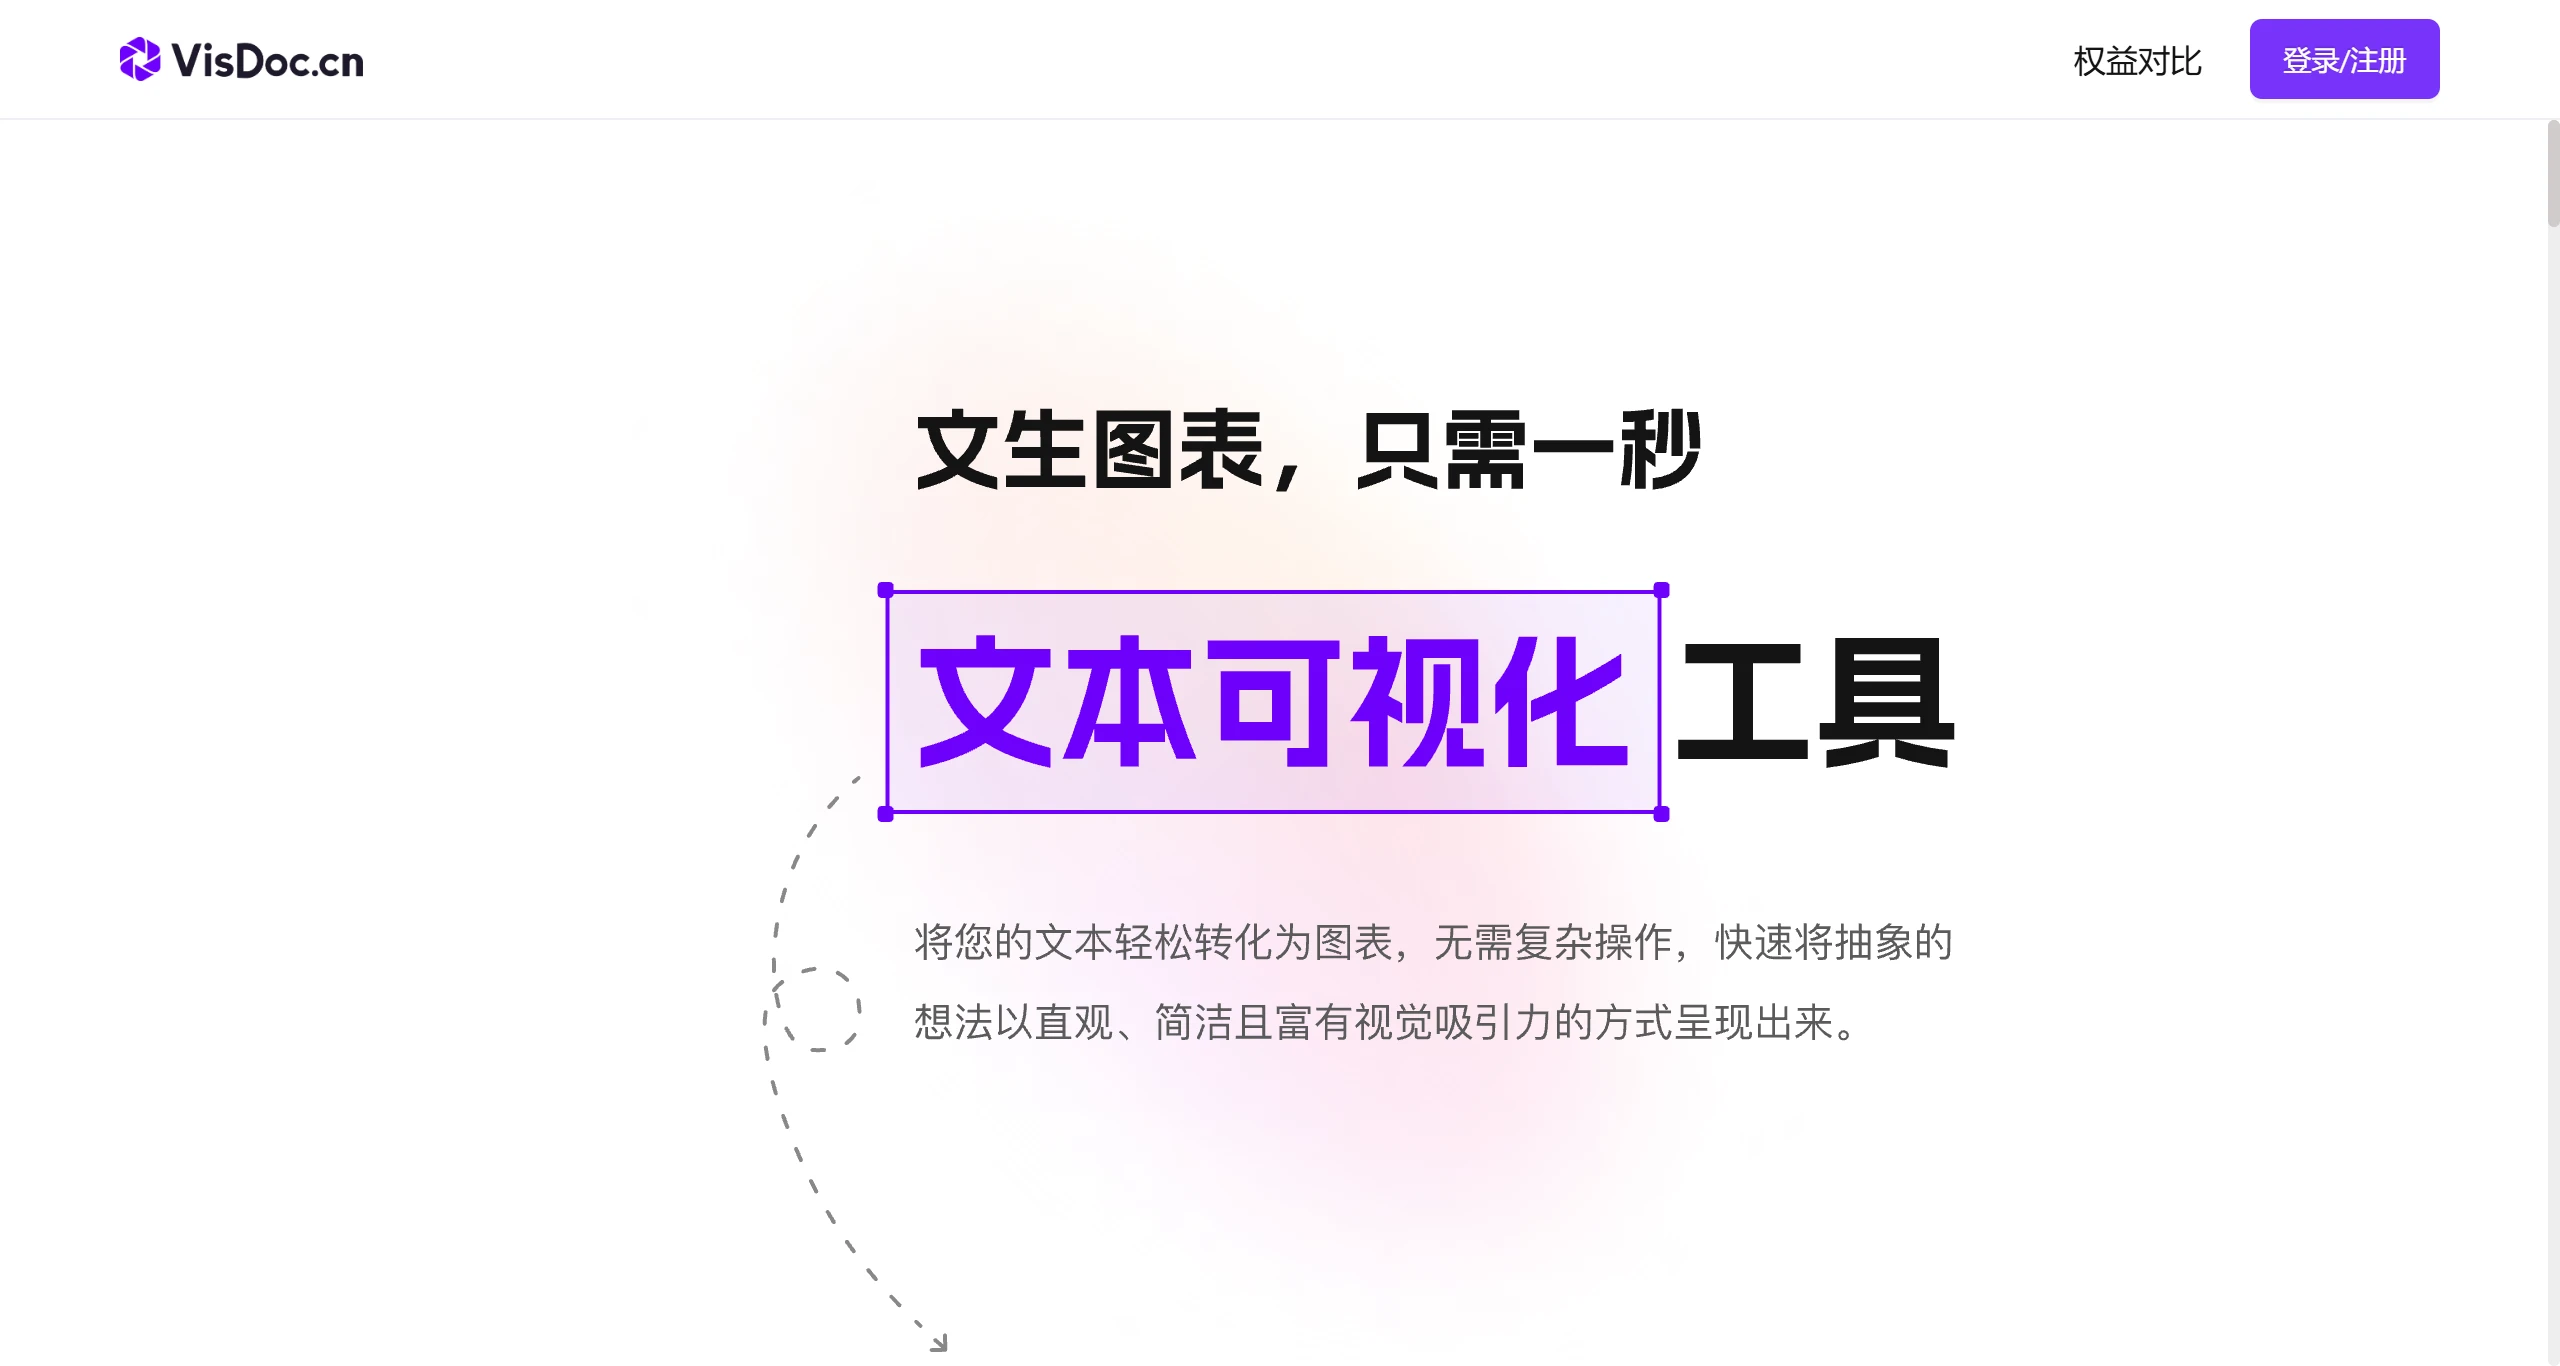
VisDoc is a tool that automatically generates charts based on text descriptions provided by users. It can easily transform your text into charts without complex operations, quickly presenting abstract ideas in an intuitive, concise, and visually appealing way.
VisDoc visualizes your thinking and quickly generates professional diagrams such as block diagrams and flowcharts.
Features of VisDoc Text-to-Chart:
Rapid Generation: Simply enter prompts to generate charts with one click, saving time.
Highly Customizable: Supports free adjustment of chart details, including colors, styles, etc., to meet personalized needs.
Multiple Chart Types: Provides various chart types such as line charts, bar charts, and pie charts, adapting to different scenarios.
Seamless Integration with ppt: Generated charts can be directly used in PPT creation, enhancing overall aesthetics and professionalism.
VisDoc Chart Applications:
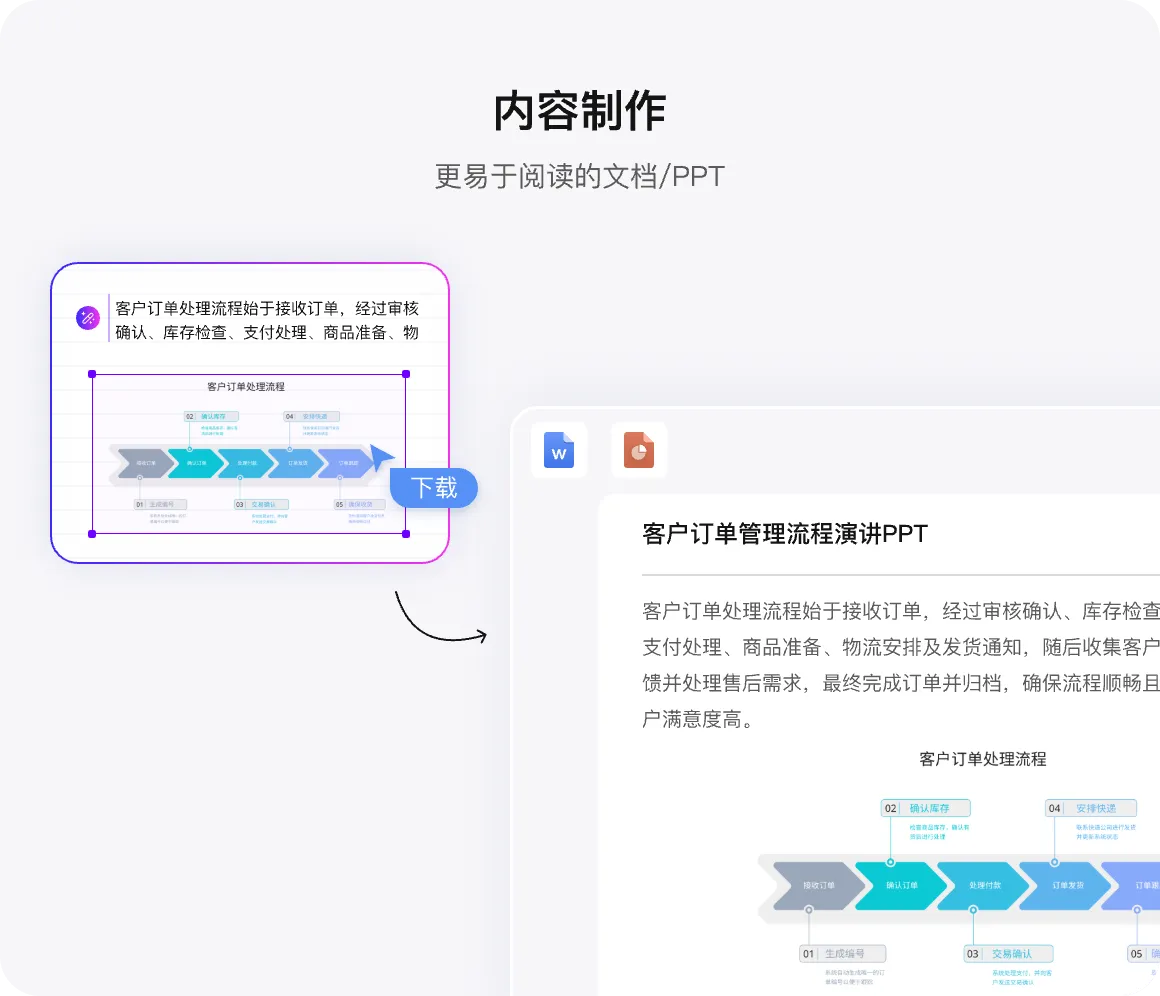
Data Analysis: In the business and scientific research fields, VisDoc Text-to-Chart can help analysts quickly extract valuable information from large amounts of text data and present it in chart form.
Education: In the education field, teachers can use this tool to convert course content into charts.
Report Generation: When writing reports, VisDoc Text-to-Chart can automatically generate charts.
Marketing: Marketers can use this tool to analyze market trends and consumer feedback, presenting the results in chart form.
Social Media: On social media, VisDoc Text-to-Chart can help users quickly create eye-catching visual content.
How to Use VisDoc:
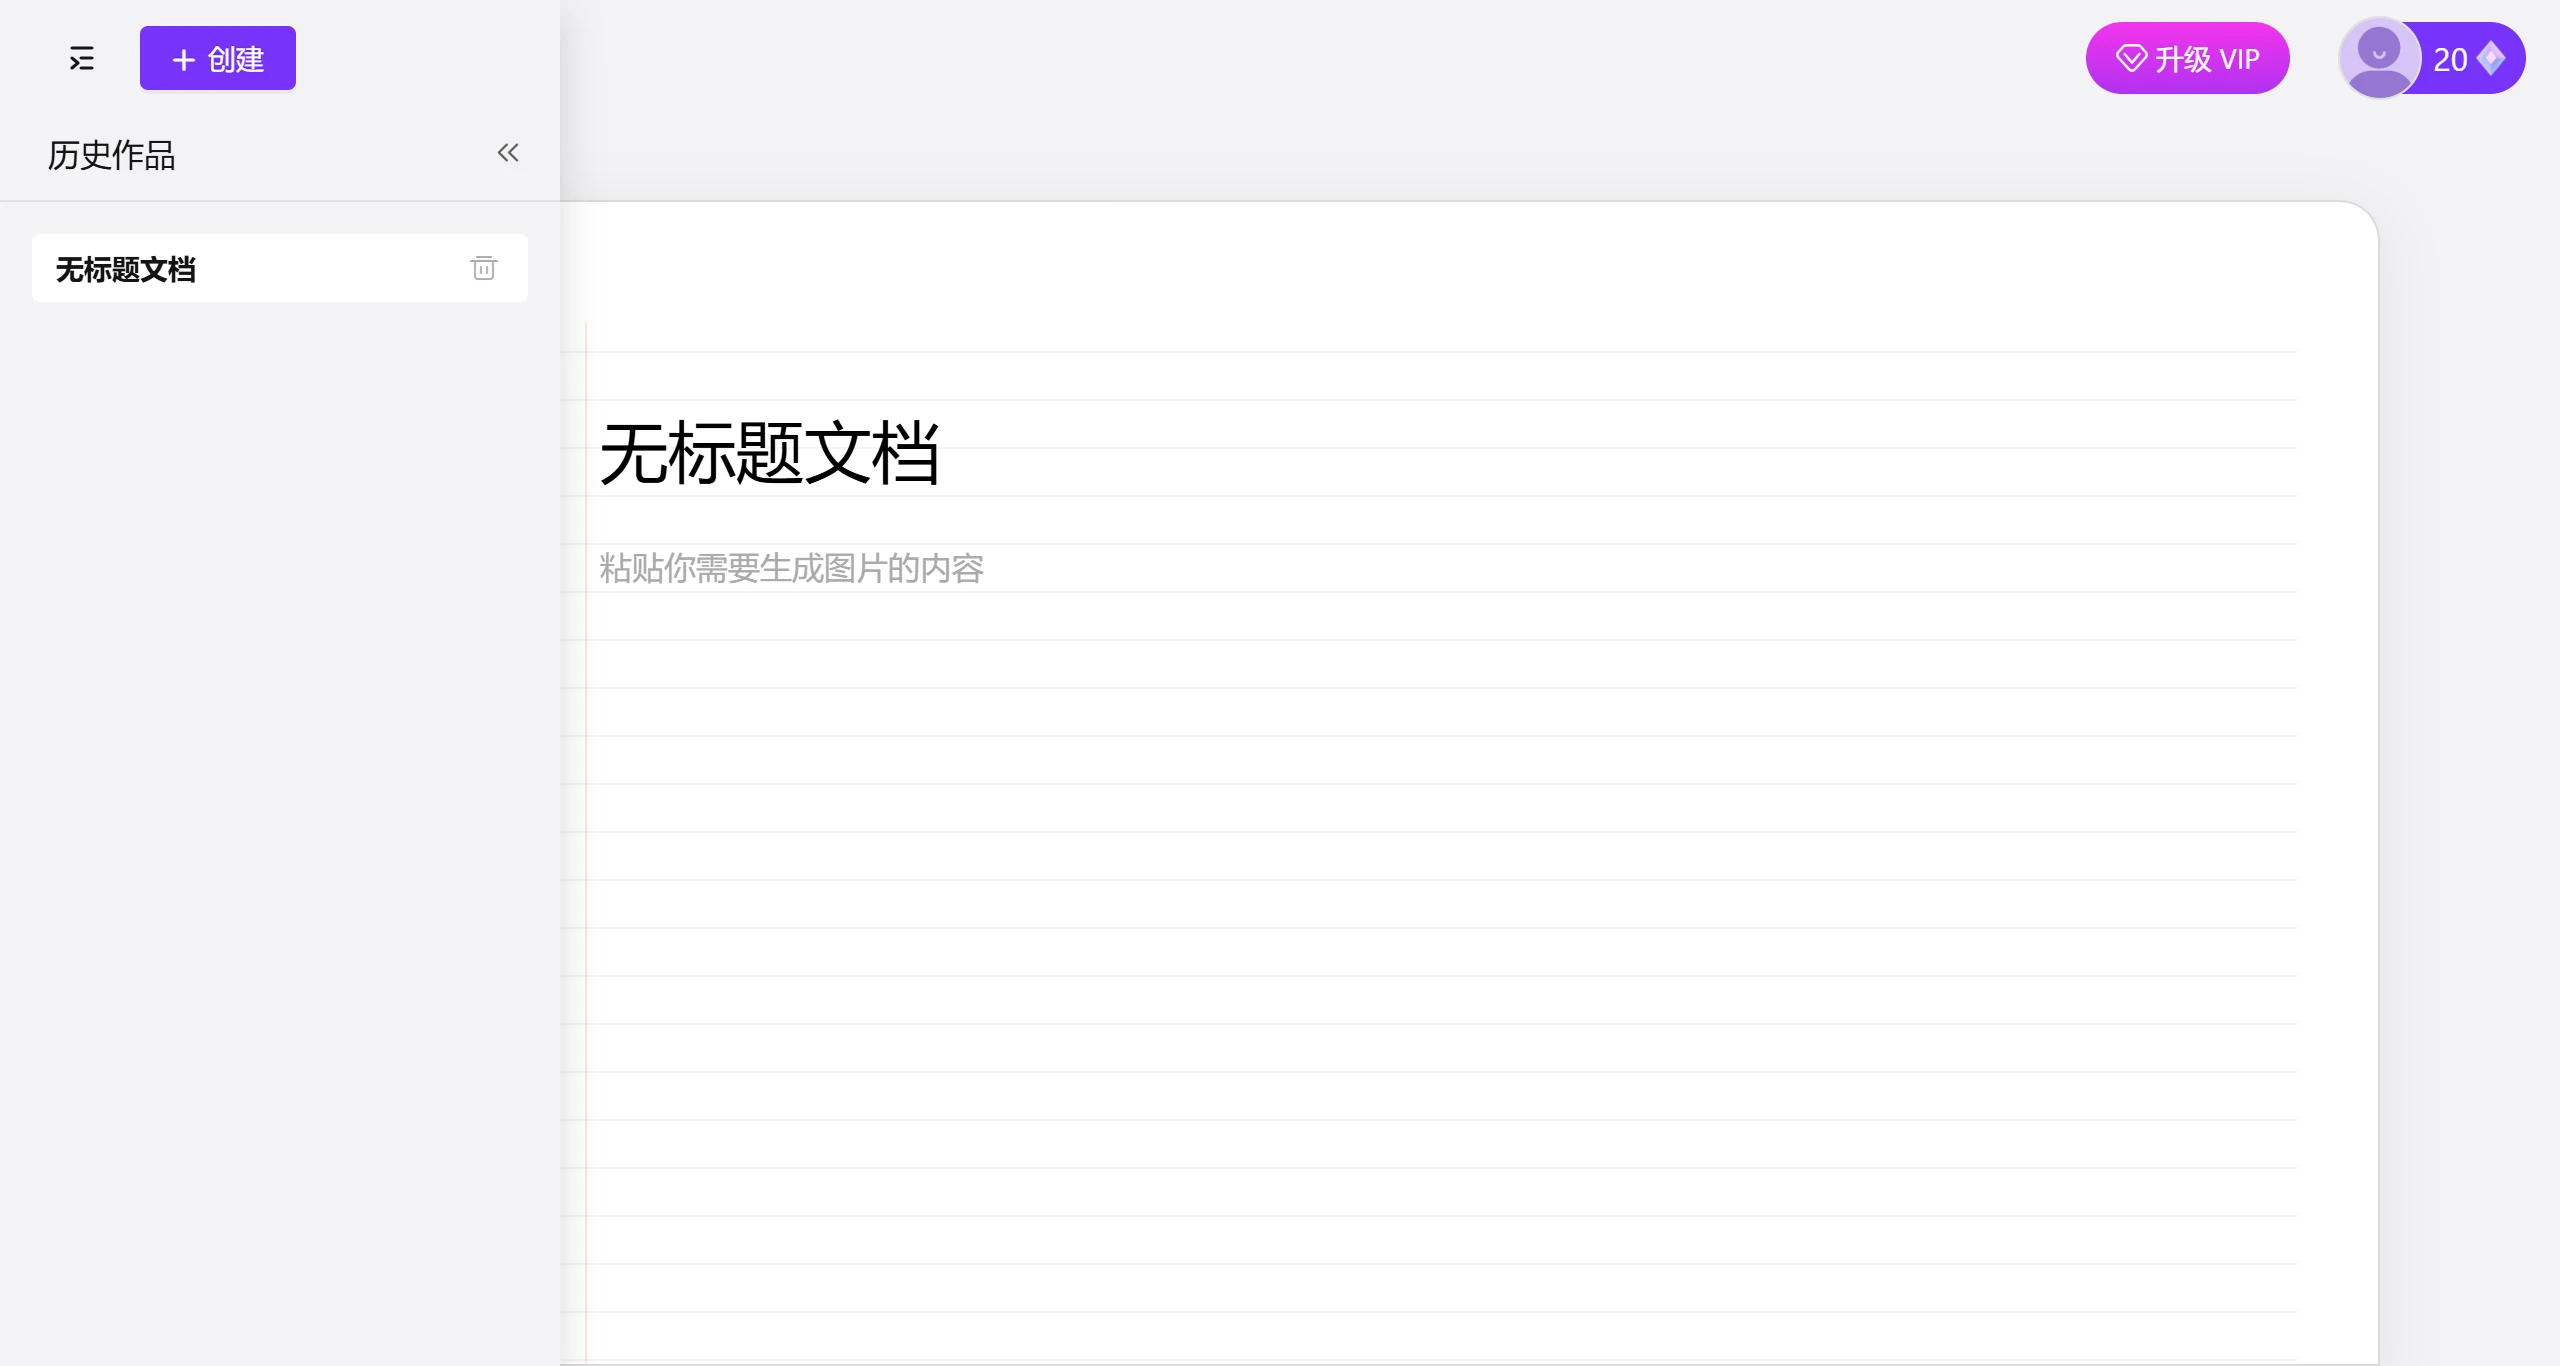
Text Paste/Input: Paste your text or input content, and operate according to your text.
Click Visualize to Generate: Generate charts based on your text, then select the visual effect that best expresses your ideas.
Data Export: Export as .png, .pdf, or .svg to enhance the visual quality of your text content.
VisDoc Pricing and Permissions:
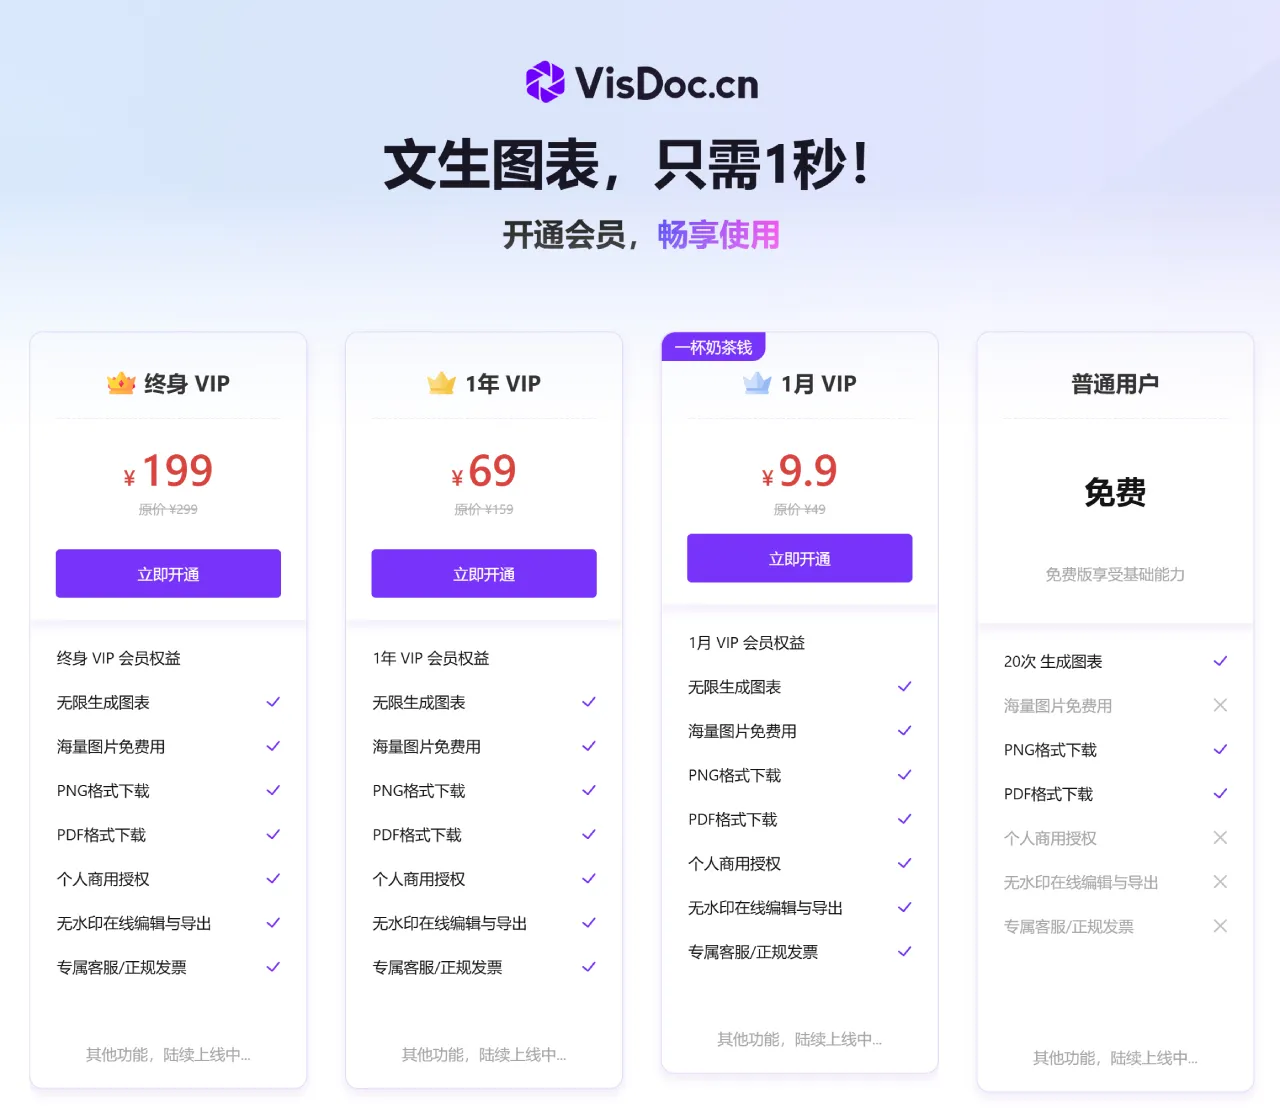
VisDoc offers a free version with basic capabilities, including 20 chart generations, PNG format download, and PDF format download. Then there are three tiers: 1 month: 9.9 yuan, 1 year: 69 yuan, and Lifetime VIP: 199 yuan.
VisDoc Text-to-Chart works even better when combined with AIPPT.
Related Information: