Script Planner Assistant▸
 AI Apps
 AI News

AntV: A Data Visualization Component Library by Ant Group
AntV: A Data Visualization Component Library by Ant GroupIntroduction
AntV is a data visualization solution launched by Ant Group, designed to help users better understand and present data through charts and visualization tools. AntV includes multiple components and libraries, mainly including G2 for statistical charts, S2 for multidimensional tables, G6 for relationship graphs, X6 for flowcharts, and L7 for maps.
Main Components of AntV:
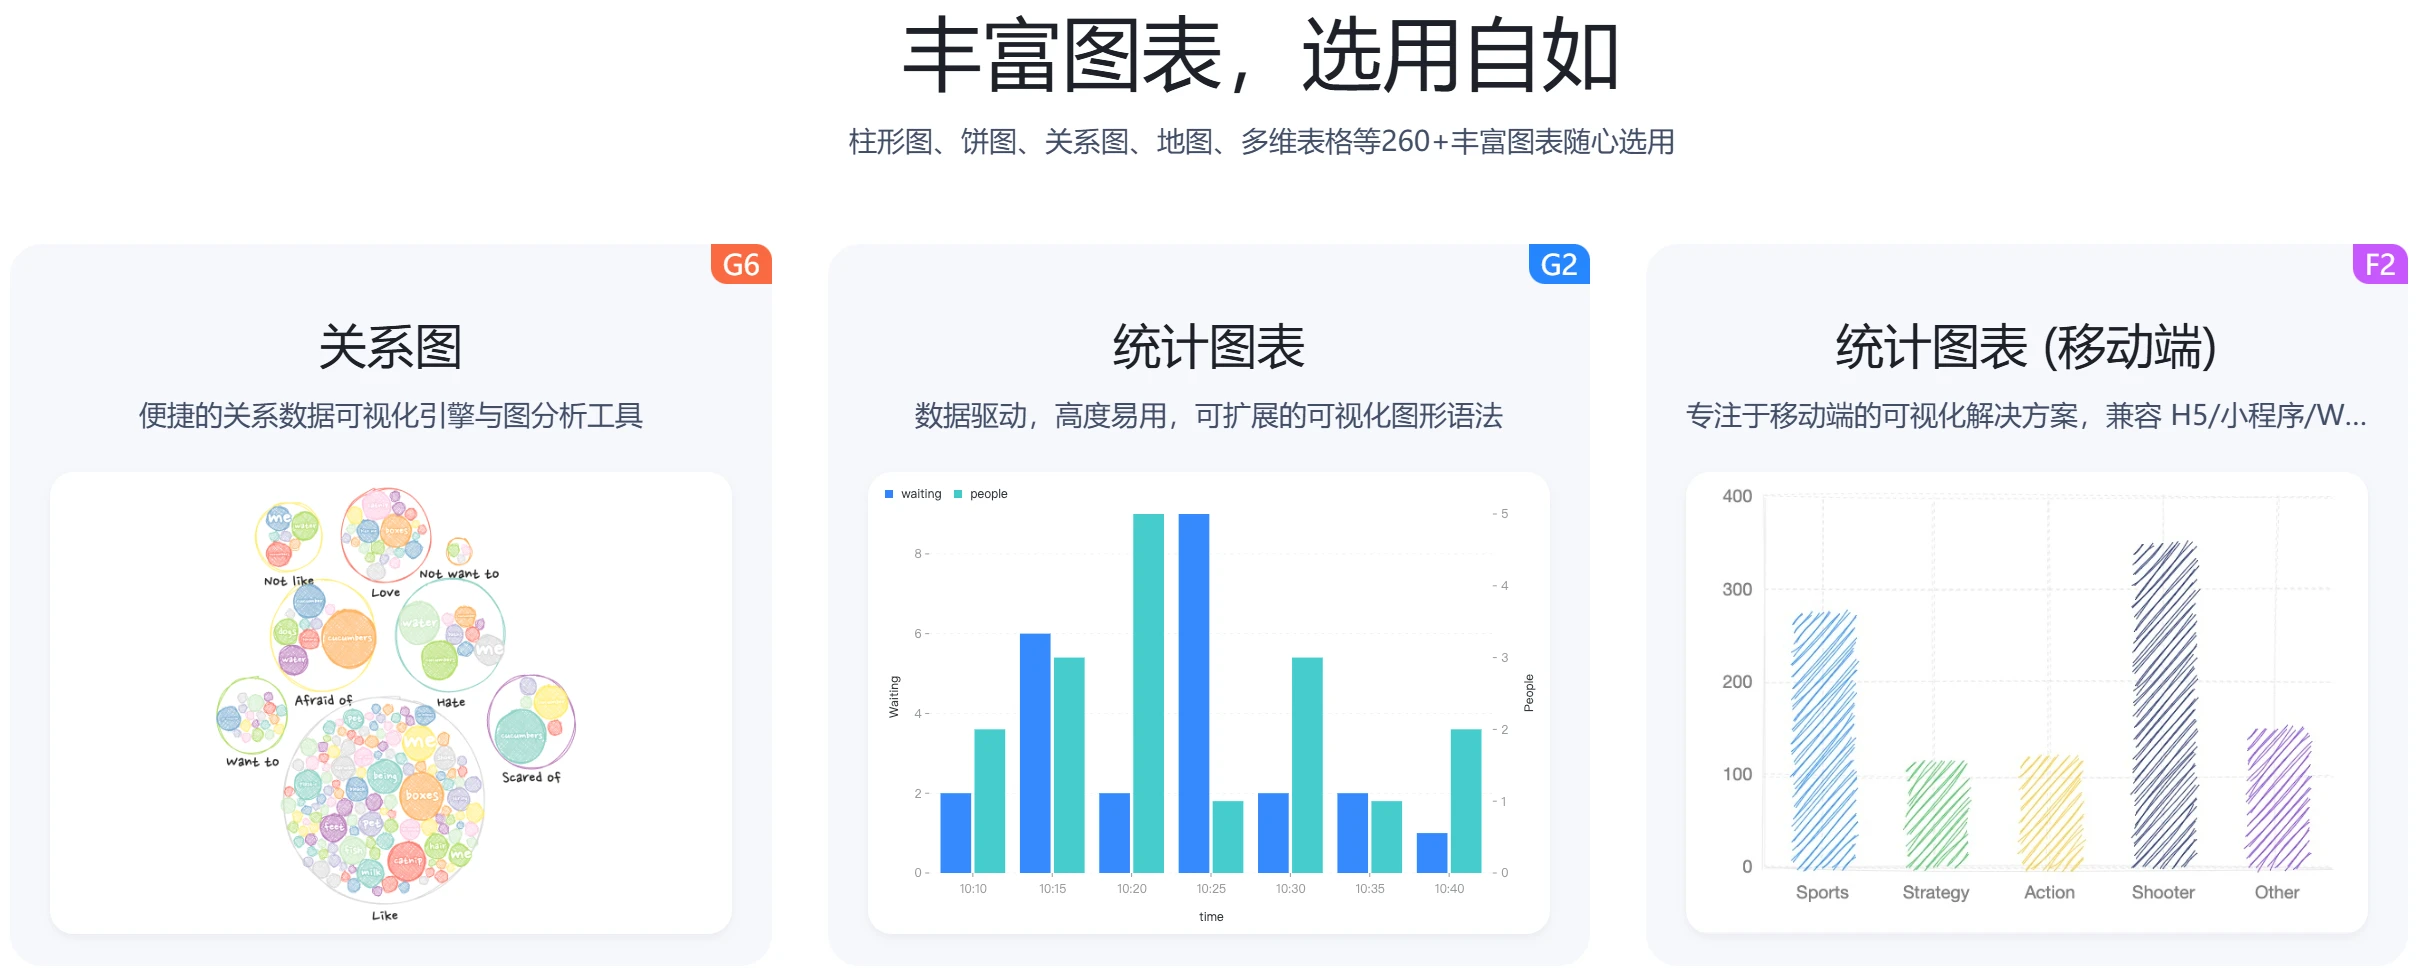
G2: is a concise and progressive visualization grammar, focusing on building statistical charts. It offers high usability and extensibility, allowing users to quickly create various interactive charts with simple syntax. G2's design philosophy is "data-driven," where users only need to focus on the data itself without worrying too much about implementation details1418.
G6: is a graph visualization engine that focuses on visualizing relational data. It provides rich graphical and interactive features, suitable for building complex network and relationship graphs. G6's high customization capability allows developers to flexibly adjust the style and interaction of graphs according to their needs34.
F2: is a chart library specifically designed for mobile devices, aimed at providing a smooth user experience. It supports multiple chart types and is suitable for displaying data on mobile devices, ensuring clarity and readability even on small screens48.
L7: is a geographic data visualization library, focusing on the display of maps and geographic information. It supports various map types and the visualization of geographic data, making it suitable for displaying geographic-related data analysis and presentations.
Main Features and Characteristics of AntV
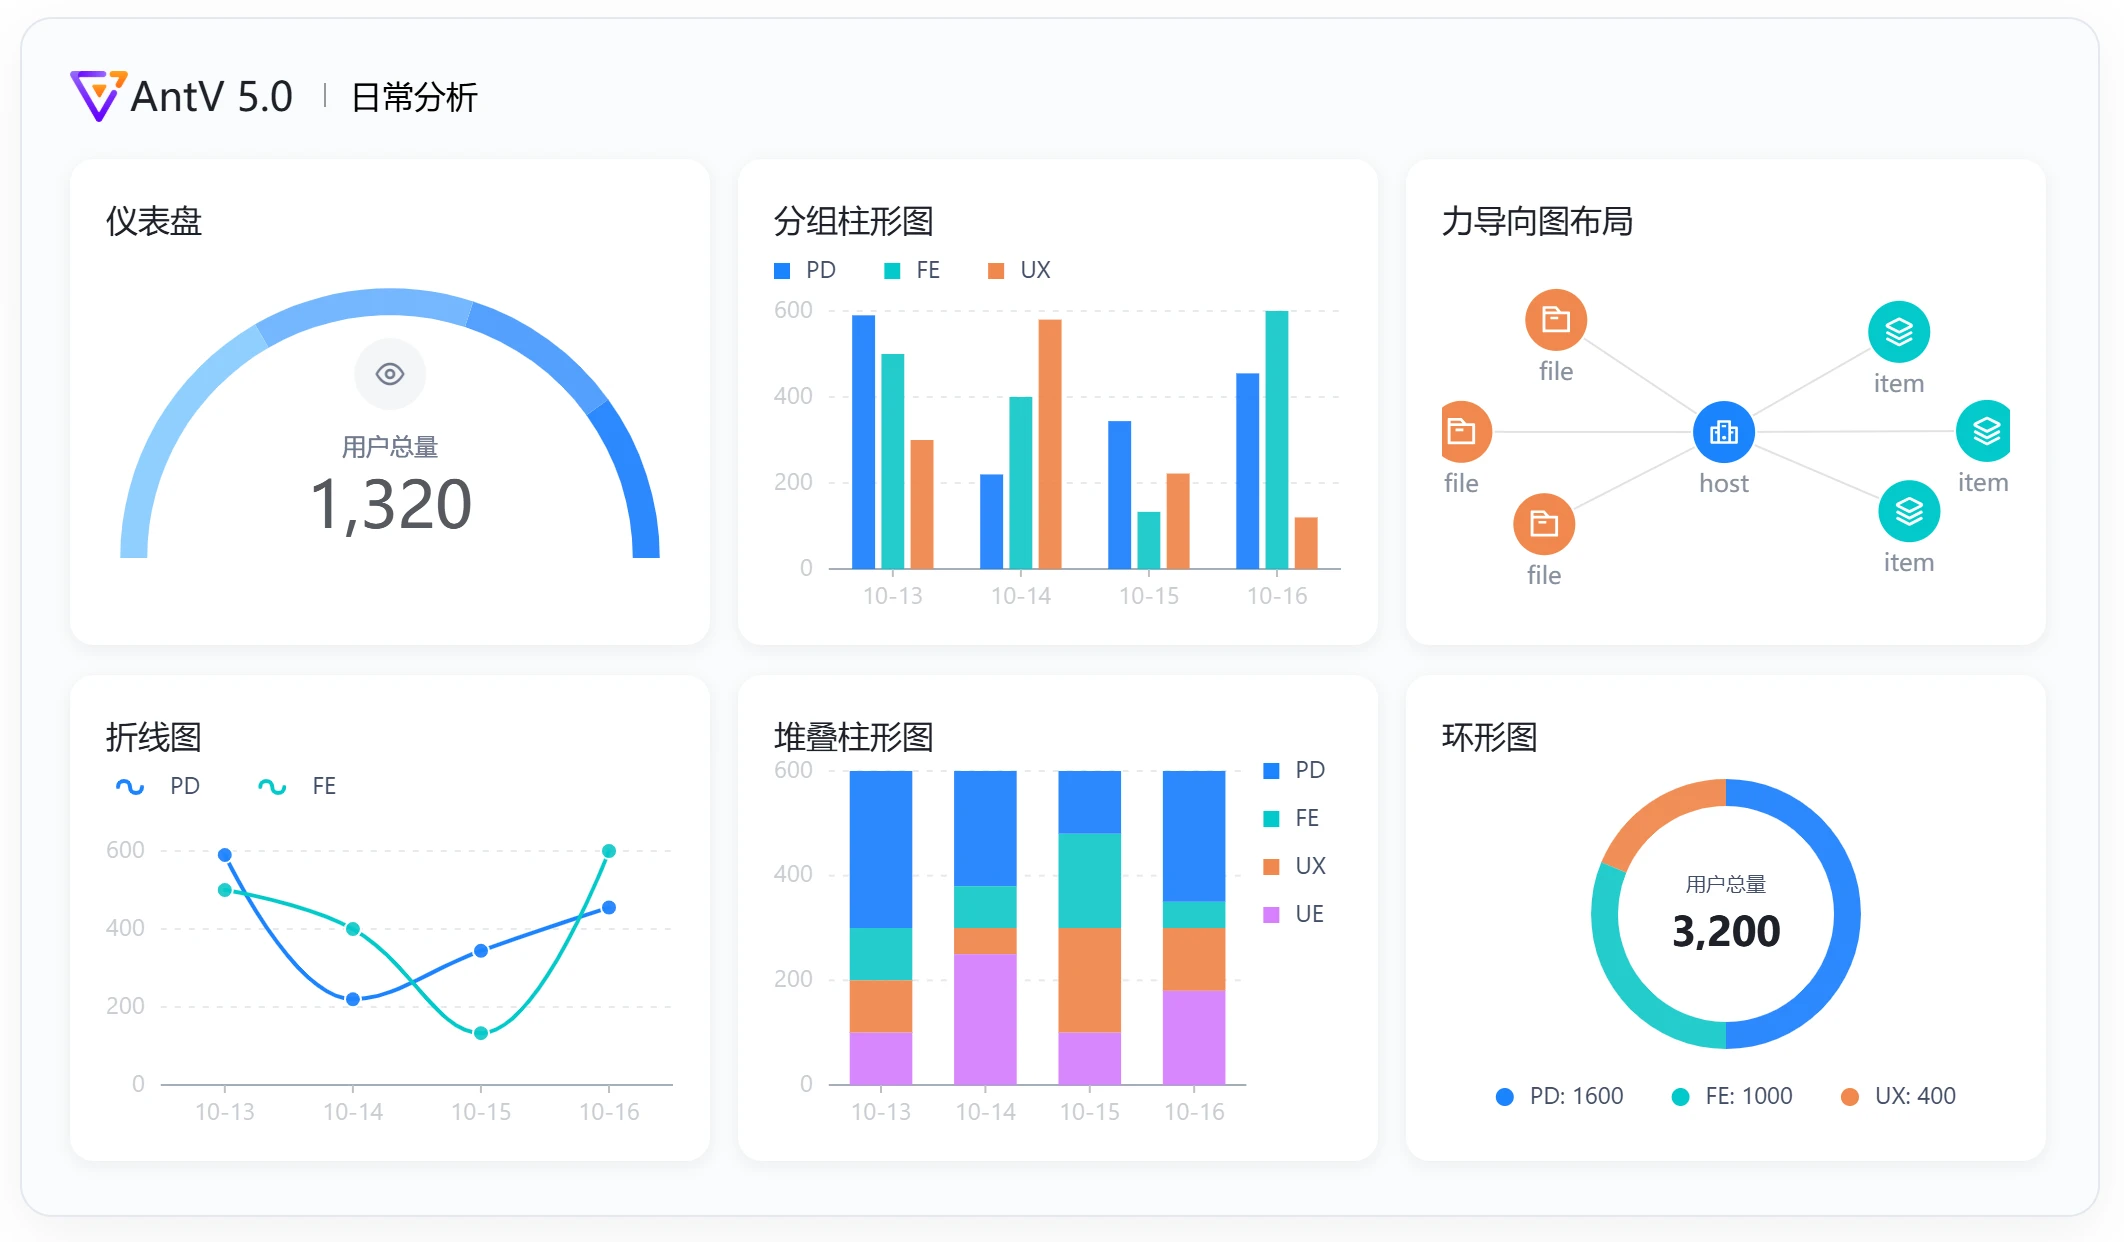
Customizable Themes, One-Click Generation: AntV version 5.0 provides multiple theme templates, allowing users to choose suitable themes according to their needs. These charts are not only aesthetically pleasing but, more importantly, can be generated with one click, greatly saving users' time and effort.
Performance Leap, Professional and Elegant: In addition to rich chart types, AntV also performs excellently in terms of performance. It supports rendering large 3D graphs, can handle massive data, and ensures smooth interactive experiences. The introduction of narrative animations and WebXR technology makes data visualization works more vivid and engaging.
Rich Charts, Flexible Selection: AntV offers over 260 chart types, covering various data visualization needs including bar charts, pie charts, relationship graphs, maps, and multidimensional tables. These charts are not only numerous but also of high quality, capable of meeting users' needs in different scenarios.
AntV Application Scenarios
Regarding the application scenarios of data visualization, AntV is not only suitable for business data analysis but also widely used in education, scientific research, and public data display. By combining different visualization tools, users can choose the most appropriate solution based on specific needs, thereby enhancing data readability and impact.
Business Intelligence: Display key performance indicators in data analysis dashboards.
Financial Risk Control: Use graph visualization to analyze complex transaction networks.
Smart Cities: Visualization of geospatial data, such as traffic flow analysis.
Knowledge Graphs: Display relationships between entities to aid decision-making.
Product Analytics: User behavior tracking and analysis to enhance user experience.
Enterprise Applications: AntV has supported over 20,000 business systems within and outside Alibaba Group and Ant Group, passing the rigorous test of products with daily tens of millions of UVs.
Data Lineage Visualization: Supports parsing Hive SQL to generate lineage graphs, with support for switching between field-level lineage and table-level lineage display.
AntV Official Website:
https://antv.antgroup.com/zh
AntV Project Address:
https://github.com/antvis/antvis.github.io