Script Planner Assistant▸
 AI Apps
 AI News

DaPanYunTu: Real-Time A-Share Market Heatmap & Analytics
DaPanYunTu: Real-Time A-Share Market Heatmap & AnalyticsIntroduction
The Market Overview Cloud Chart, also known as the Stock Market Heatmap, is an innovative stock-watching tool that provides a real-time heatmap and market analysis platform for A-shares. By grouping all stocks into sectors based on their industry, the Market Overview Cloud Chart uses color coding and a graphical arrangement displayed in the form of squares. The color intensity of each square represents the magnitude of the stock's price change—red indicates a decline and green indicates a rise—offering an intuitive panoramic view of the overall market.
The Market Overview Cloud Chart helps investors quickly understand the market dynamics of the entire market or specific industry sectors. It overturns the traditional pattern of red for gains and green for losses, making it suitable for stock enthusiasts and professional investors.
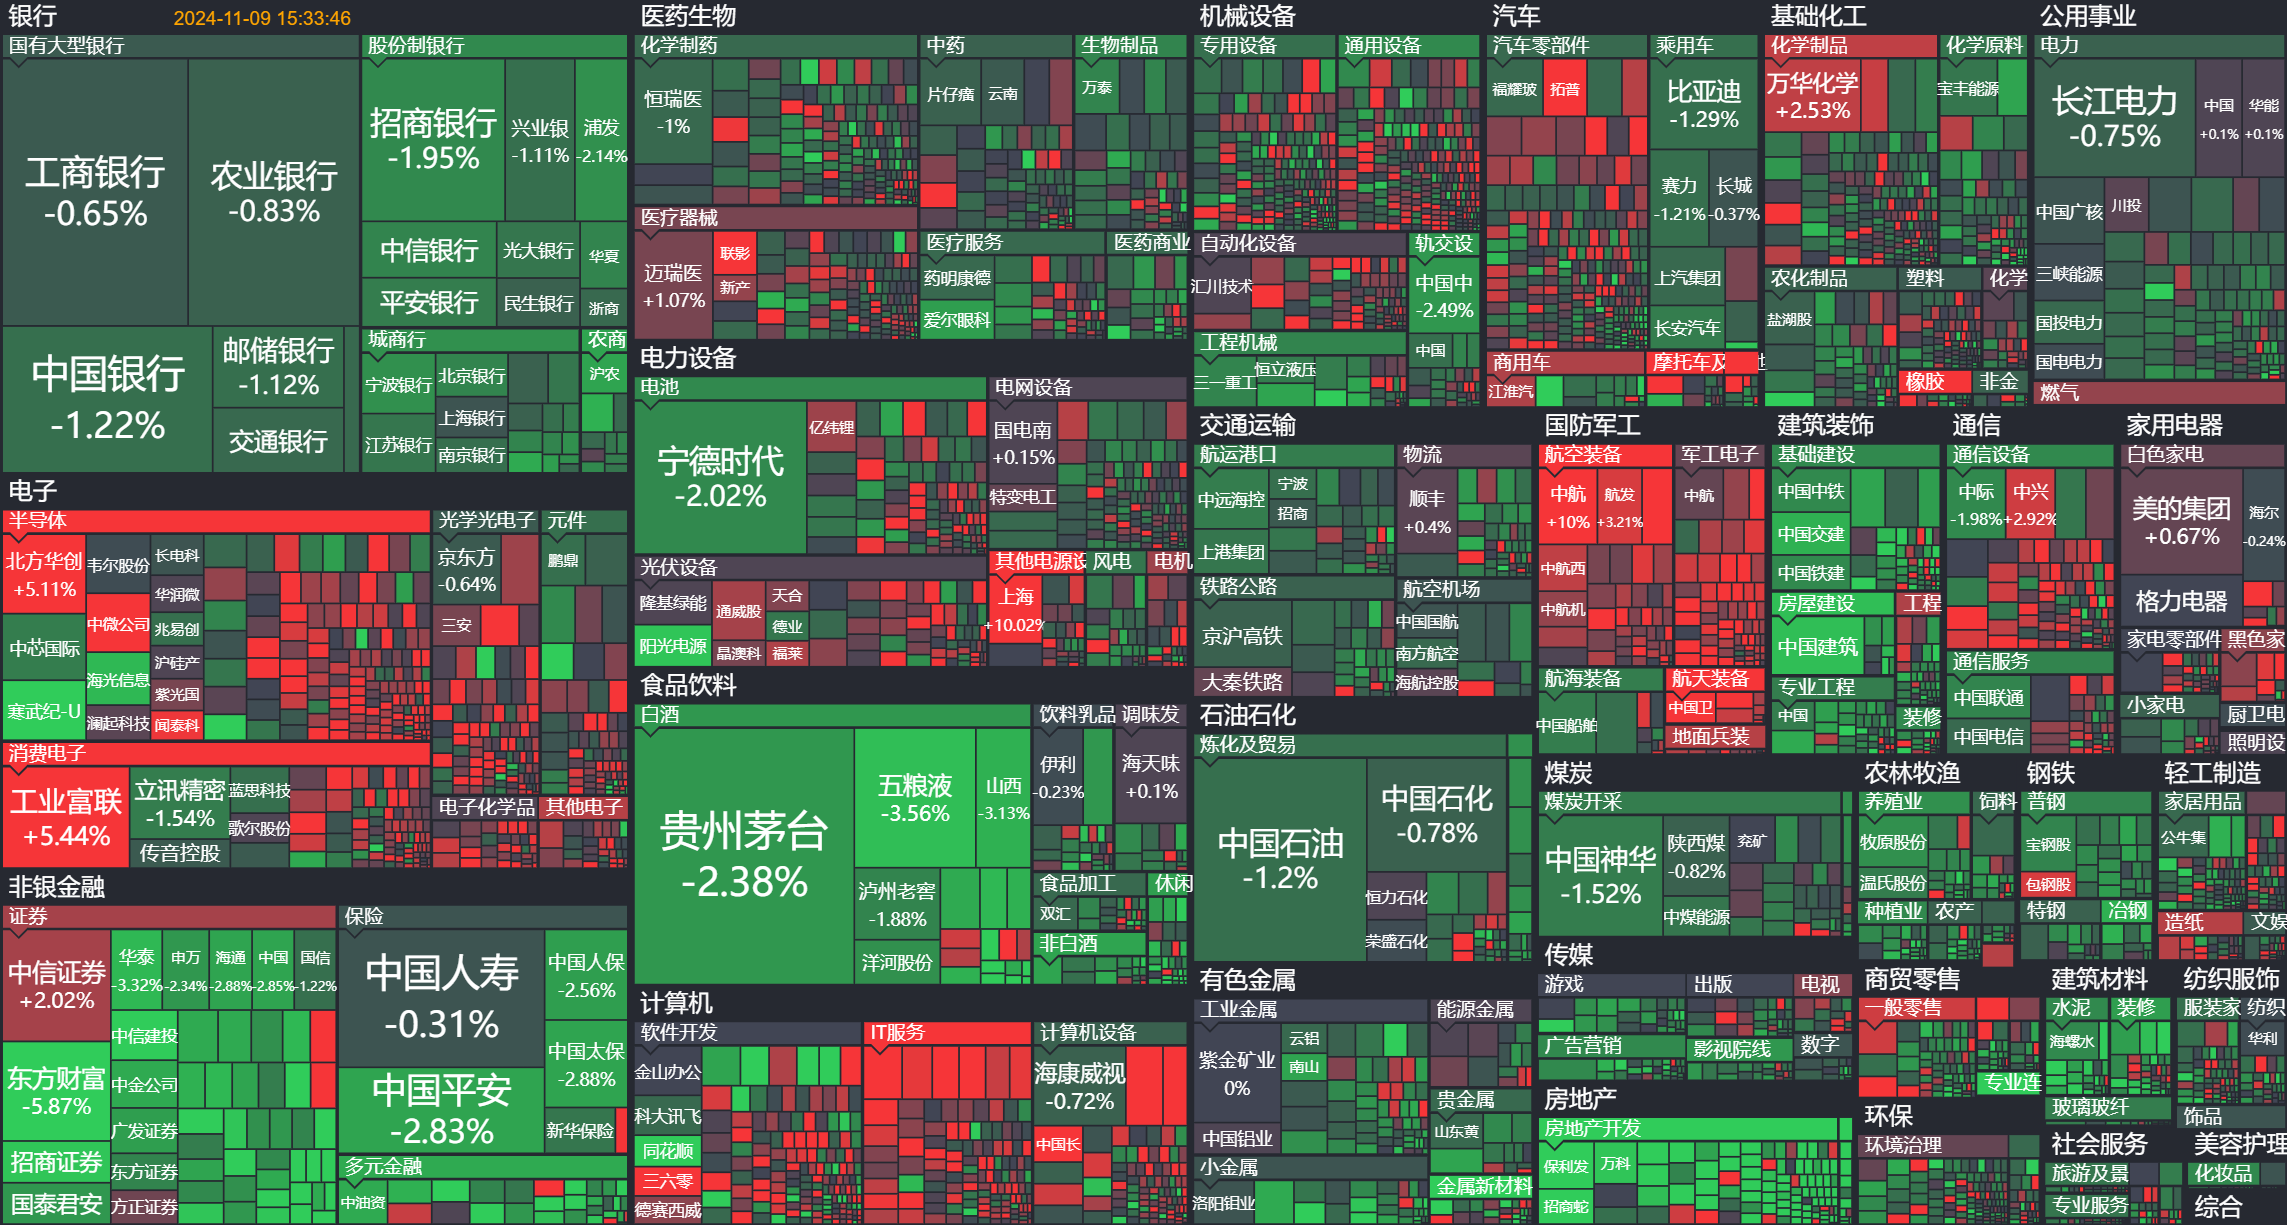
The main features of the Market Overview Cloud Chart include:
Intuitive Display: Through color and area size, investors can see at a glance which industries or stocks are the market hotspots.
Real-time Updates: Data is refreshed every 15 seconds, ensuring users get the latest market information.
Sector Classification: Stocks are divided into different industry sectors based on industry or custom categorization, helping to analyze the performance of market sectors and making it easier for users to analyze the performance of specific industries.
Multi-dimensional Analysis: In addition to price changes, users can also view other key indicators such as capital flow, volume ratio, and price-to-earnings ratio.
Sorting by Circulating Market Cap: The Market Overview Cloud Chart sorts stocks by circulating market capitalization, taking into account that non-circulating market value has a relatively small impact on trading.
Interactive Functions: Users can scroll, drag, or double-click to view the K-line chart of an individual stock, or switch between different views and periods to view information on different stocks. Double-clicking a color block allows you to view its K-line chart.
Usage scenarios of the Market Overview Cloud Chart:
Market Overview: Quickly understand the overall market sentiment and industry dynamics.
Hotspot Capture: Identify which industries or stocks are leading the market.
Strategy Development: Combined with micro-level analysis such as individual stock K-line charts, assist in making investment decisions.
Educational Tool: For beginners learning about the stock market, it provides an intuitive way to learn about market dynamics.
The Market Overview Cloud Chart simplifies the interpretation of complex market data through visualization, enabling investors to monitor market dynamics more efficiently and better watch the market and analyze market trends.