
 Script Planner Assistant▸
 AI Apps
 AI News
Veusz: An Open-Source, Cross-Platform Tool for Professional Charting
小编 ·

Veusz: An Open-Source, Cross-Platform Tool for Professional Charting
What is Veusz?
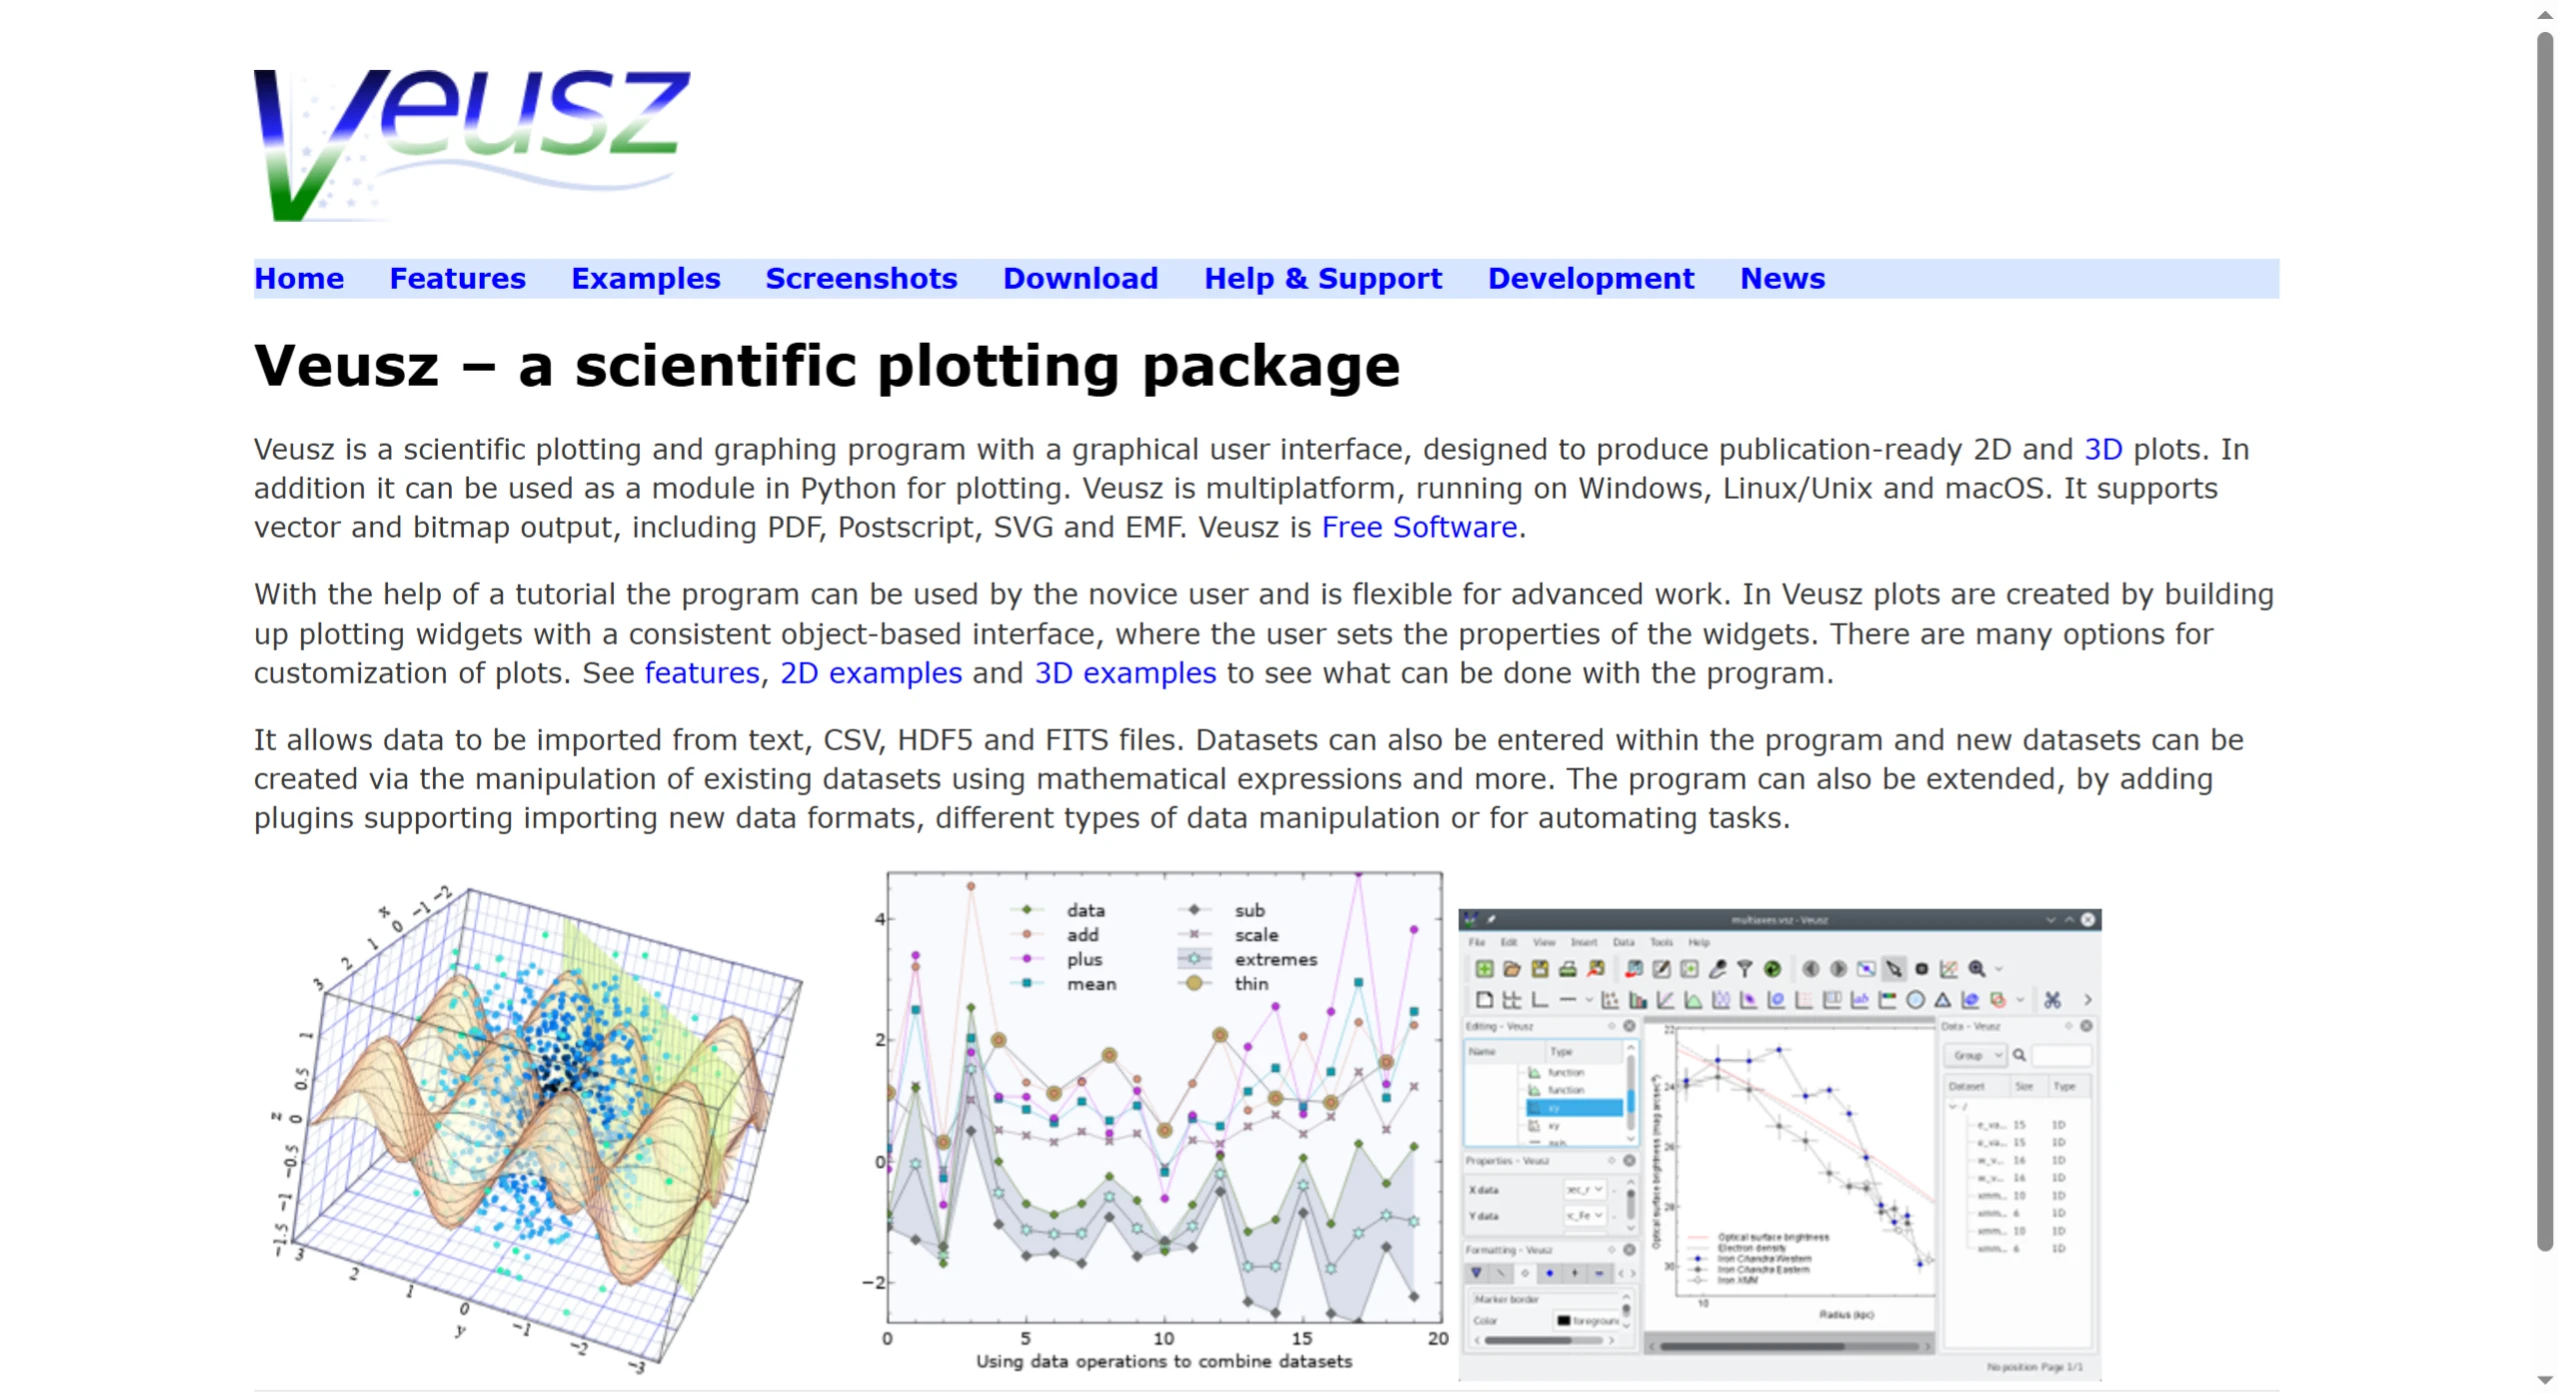
Veusz is an open-source, cross-platform professional charting tool that helps researchers and data analysis professionals quickly produce high-quality professional charts. It supports over 20 chart types, including X-Y plots, contour plots, and histograms, and also supports LaTeX formatting to meet academic publication requirements. Veusz can be operated through a graphical interface, or used via a Python module or command line, which is very convenient. It can import common data formats such as HDF5, CSV, FITS, and NPY, and can process data directly within it without the need for additional tools. If more functionality is needed, it can be extended with plugins, and finally export charts to PDF, EPS, PNG, or SVG formats.
Veusz Core Features
Diverse Chart Types
Basic charts: line charts, bar charts, scatter plots, pie charts, area charts, etc.
Professional charts: error bar plots, histograms, heatmaps, 3D charts, polar plots, vector field plots, etc.
Supports multi-subplot layouts for combining complex data visualizations.
Highly Customizable
Style adjustments: freely modify details such as colors, line styles, fonts, axis labels, and legend positions.
Mathematical expression support: LaTeX formulas can be inserted into charts, suitable for academic paper chart annotations.
Data processing: built-in data smoothing, interpolation, statistical calculation, and other functions, no need to rely on external tools for data preprocessing.
Cross-Platform and Open Source
Built on Python and Qt, supports Windows, macOS, and Linux, with a unified and smooth interface.
Open-source license (GPLv2) allows users to freely use, modify, and share, suitable for open-source projects or educational scenarios.
Data Import and Export
Supports multiple data formats: CSV, Excel, text files, and even can directly read Python data structures.
Rich export formats: PDF, EPS, SVG (vector graphics), PNG, JPEG, etc., meeting the needs of publication printing or screen display.
Scripting and Automation
Provides a Python API, allowing batch chart generation through scripts, suitable for repetitive data analysis tasks.
Users can record operation steps to generate scripts for quickly reproducing chart styles.
Veusz Application Scenarios
Research and Academia
Creating paper illustrations (such as experimental data comparison and statistical result visualization).
Supports high-resolution output and vector formats, meeting journal submission requirements.
Engineering and Data Analysis
Industrial data monitoring charts, signal processing waveform diagrams, geographic information visualization (such as contour maps).
Combine error bars and statistical distribution charts to display data uncertainty.
Education and Presentation
Create teaching illustrations and dynamic data change demonstrations (through animation features).
Supports interactive operations (such as zooming and panning), convenient for showing details in reports.
Veusz Usage Workflow
Interface Overview
Left panel: Layer manager (manages chart elements such as axes, data series, and annotations).
Right panel: Property editor (adjusts the style and parameters of the selected element).
Main window: real-time preview of charts, supports drag-and-drop layout adjustments.
Workflow
Import data: import data via files or clipboard, or manually enter directly in the table.
Select chart type: create the required chart from the menu or toolbar, automatically associating data columns.
Style adjustment: modify colors, fonts, axis ranges, etc., add titles, legends, and annotations.
Export or save: generate images/vector files, or save as Veusz project files (.vsz) for later editing.
Pros and Cons
Pros:
Open-source and free, with no commercial licensing restrictions.
Supports advanced customization and scripting operations.
High-quality vector graphic output, suitable for printing scenarios.
Cross-platform features, can be used on Windows, macOS, and Linux systems.
Cons:
High entry barrier, complex charts require learning parameter configuration.
3D chart functionality is weaker compared to professional software (such as MATLAB).
Community documentation and tutorials are relatively scarce, mainly relying on the official manual.
Project Links
Github:https://github.com/veusz/veusz
Official Website:https://veusz.github.io/









