
 Script Planner Assistant▸
 AI Apps
 AI News
Tracy Profiler: High-Performance Profiling Tool for Games
小编 ·

Tracy Profiler: High-Performance Profiling Tool for Games
What is Tracy Profiler?
When developing games or large-scale applications, performance bottlenecks are often a headache-inducing problem, especially when a program suddenly slows down and finding the cause is even harder. We recommend an open-source tool called Tracy Profiler, which now has 11.5k Stars on GitHub. What makes this tool impressive is that it can analyze application performance in real time with nanosecond-level precision, helping developers quickly locate those performance bottlenecks that are holding things back. It can analyze not only the CPU and GPU but also handle complex things like memory allocation, locks, and context switches. Moreover, it can automatically associate screenshots with captured frames, giving you an extremely comprehensive performance monitoring view. Tracy Profiler is compatible with all major graphics APIs (such as OpenGL, Vulkan) and multiple programming languages (such as C, C++). Its visualization interface is particularly intuitive, and the API integration is also very simple, making it an absolute great helper for game developers and software engineers.
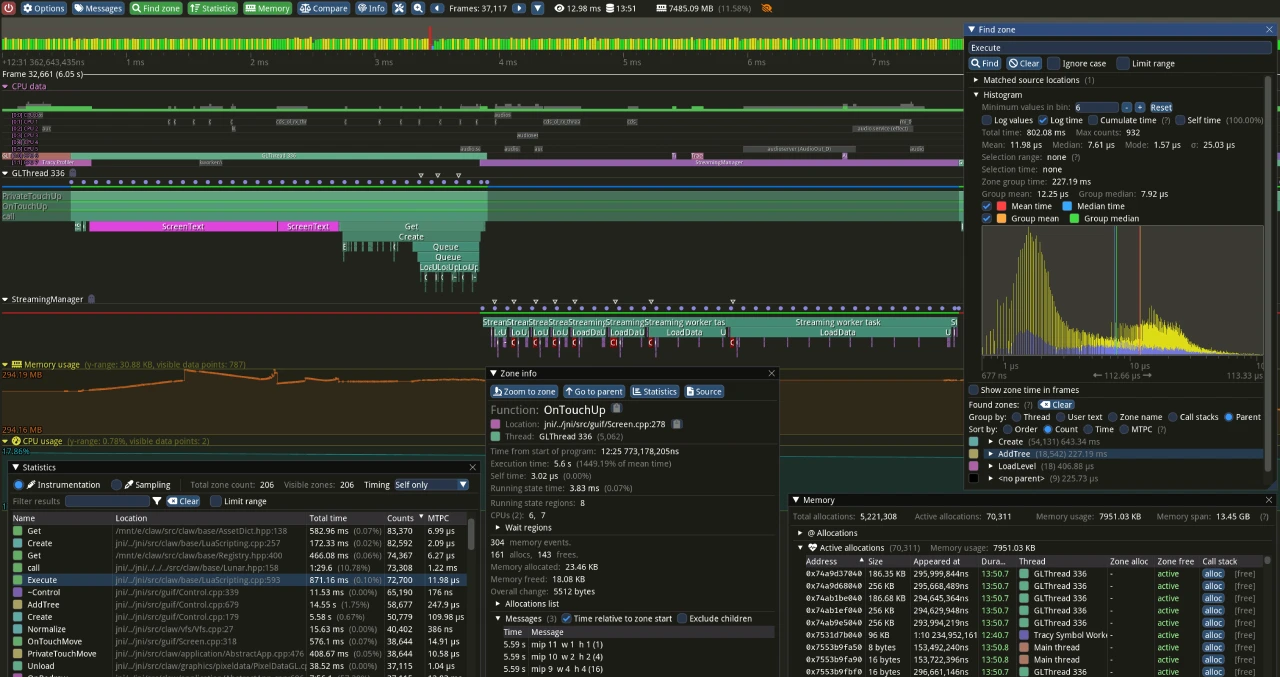
Main Features of Tracy Profiler
CPU Profiling: Supports direct integration with languages such as C, C++, Lua, Python, and Fortran. There are also many third-party bindings available on the internet for other languages (such as Rust, Zig, C#, OCaml, Odin, etc.).
GPU Profiling: Supports all major graphics APIs, including OpenGL, Vulkan, Direct3D 11/12, Metal, and OpenCL.
Memory Allocation Profiling: Capable of analyzing memory allocation situations.
Lock and Context Switch Profiling: Can analyze lock usage and context switches.
Automatic Screenshot Correlation: Able to automatically associate screenshots with captured frames.
Low Overhead: Designed to minimize the impact on application performance.
Intuitive User Interface: Provides an intuitive graphical user interface (GUI) for easy viewing of profiling data.
Advanced Features: Offers call stack capture, memory allocation analysis, and support for multi-threaded systems.
Characteristics of Tracy Profiler
Real-Time Analysis: Provides immediate feedback during program execution, allowing real-time adjustments and optimizations.
Data Visualization: Generates detailed charts and reports to help visualize application performance.
Bottleneck Identification: Identifies functions that consume the most CPU time and detects concurrency issues (such as locks and deadlocks).
Cross-Platform Support: Supports multiple platforms including Windows, macOS, and Linux.
Use Cases for Tracy Profiler
Game Development: Optimize game performance to ensure a smooth experience.
Real-Time Applications: Analyze the performance of real-time applications that require fast and consistent responses.
Enterprise Software: Identify and resolve bottlenecks in large enterprise software systems to improve efficiency and scalability.
Installation and Usage
1. Clone and Compile: You can clone the code from its GitHub repository and compile it. For example, on Linux, you can run the following commands:
git clone https://github.com/wolfpld/tracy
cd tracy
git checkout v0.10
cd profiler/build/unix/
make LEGACY=1 # For X11, if using Wayland simply run 'make'
2. Run: After compilation is complete, run ./Tracy-release to start the profiler.
3. Integration: To integrate Tracy Profiler into an existing project, you need to clone the repository under the project's root directory and update the project's CMakeLists.txt file.
Project Address
Github:https://github.com/wolfpld/tracy
Official Website:https://tracy.nereid.pl/









