
 Script Planner Assistant▸
 AI Apps
 AI News
VisDoc User Guide and Tutorial
小编 ·

VisDoc User Guide and Tutorial
1. Introduction to VisDoc
What is VisDoc?
VisDoc is a smart tool that makes creating documents and charts more efficient. You only need to input text, and the AI can generate professional charts with one click, eliminating the tedious drawing process. With integrated online editing and content optimization features, VisDoc.cn is suitable for PPT production, writing illustrated WeChat public account articles, education and teaching, and enterprise office work, helping you easily express your creativity and boost team efficiency. Text-to-chart in just 1 second!
Main Features of VisDoc
Quick Chart Generation: Users only need to input text content, and VisDoc can automatically analyze and generate corresponding charts, greatly improving work efficiency.
Diverse Chart Types: Supports bar charts, line charts, pie charts, and many other chart types to meet data visualization needs in different scenarios.
Customizable Chart Styles: Users can adjust chart colors, titles, legends, and other styles according to their preferences, with real-time preview of modifications.
Multiple Output Formats: Generated charts can be exported as PNG, SVG, PDF, and other formats for convenient use across different platforms.
Application Scenarios of VisDoc
Data Analysis: Helps analysts quickly transform complex data into intuitive charts.
Report Writing: Makes reports more intuitive and easier to read.
Business Presentations: Displays key information through charts.
Education Sector: Helps teachers present complex knowledge points in the form of charts.
2. VisDoc User Guide Tutorial
1. How to Generate Charts
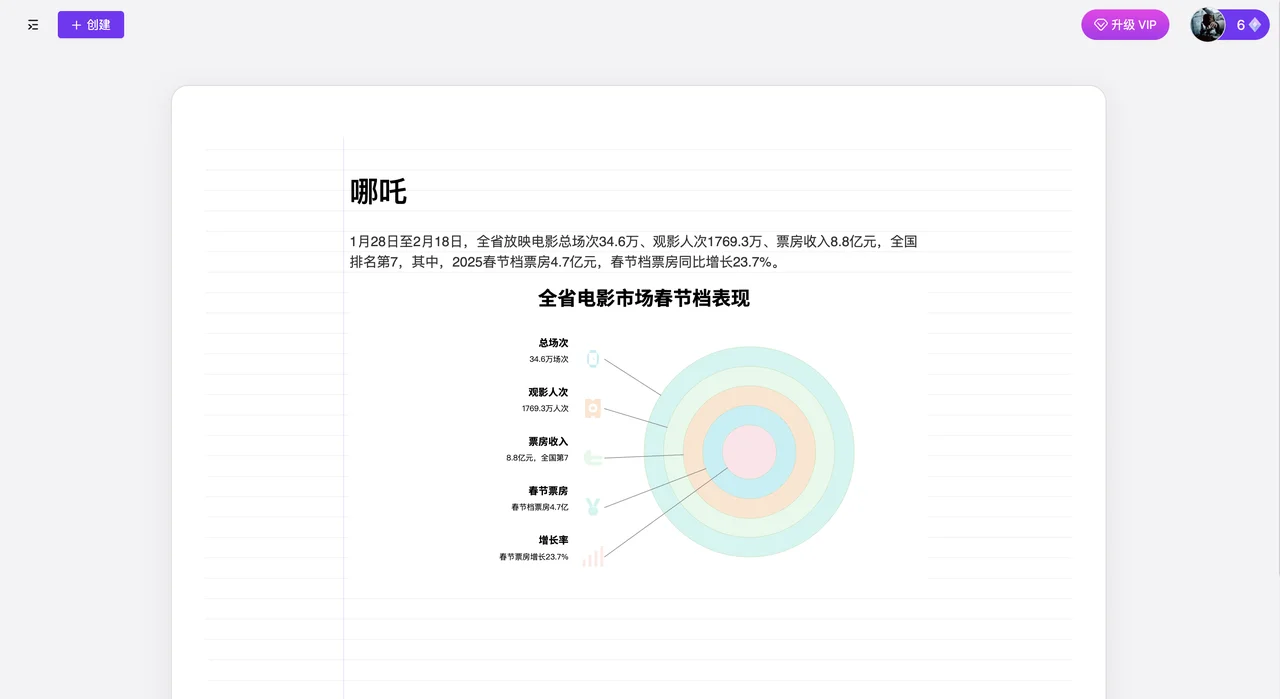
Paste or input the content you want to turn into a chart into the canvas. A magic wand will appear on the left side. Click the magic wand to generate the chart.
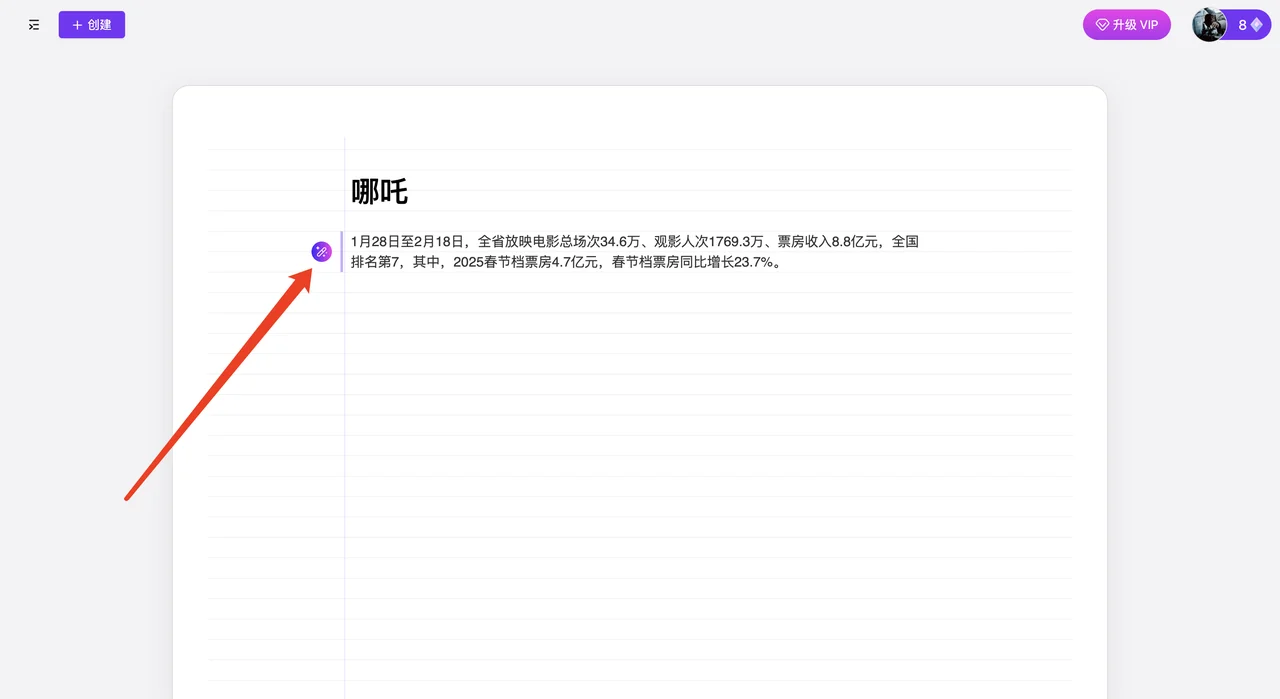
The generated result is shown below:
If there is too much content, you can generate a chart based on the selected content.
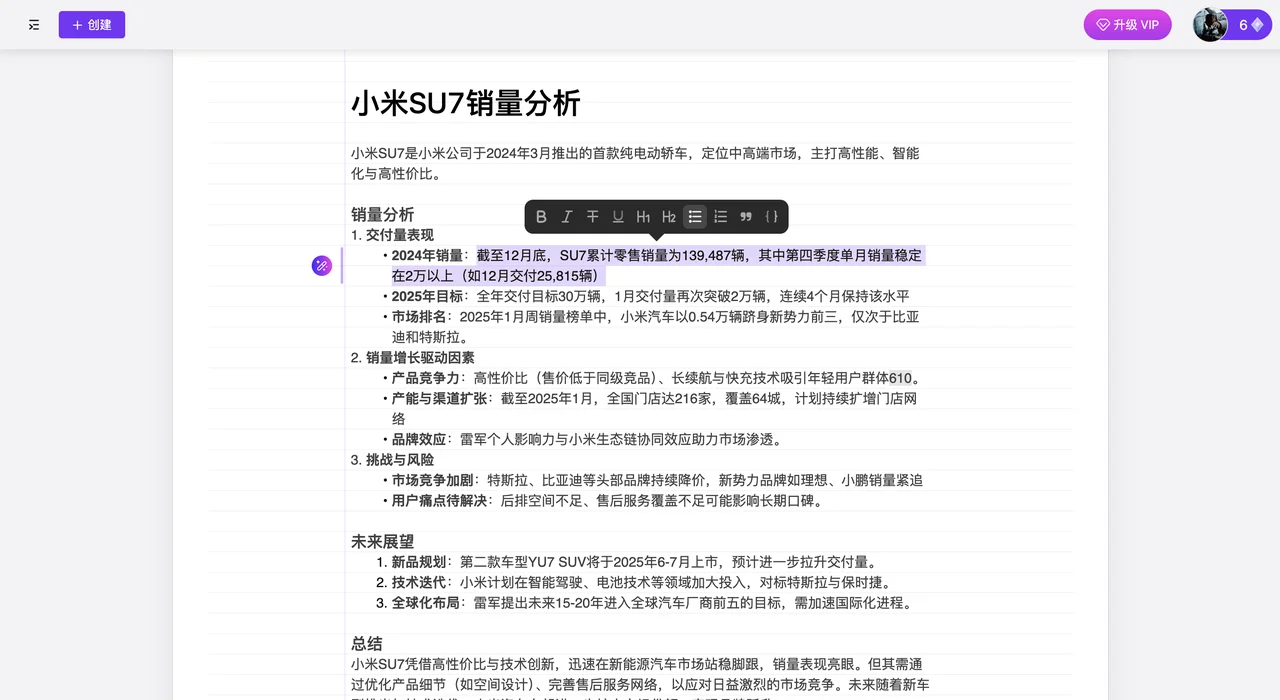
The generated result is shown below:
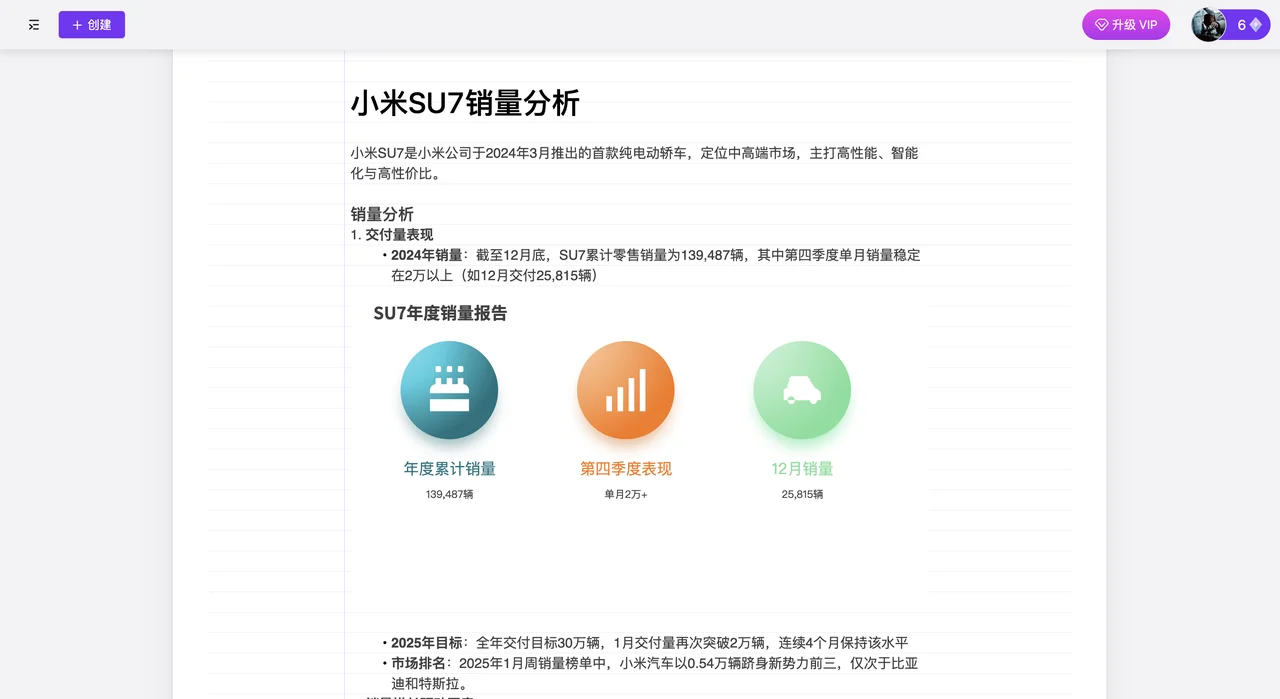
2. How to Edit Charts
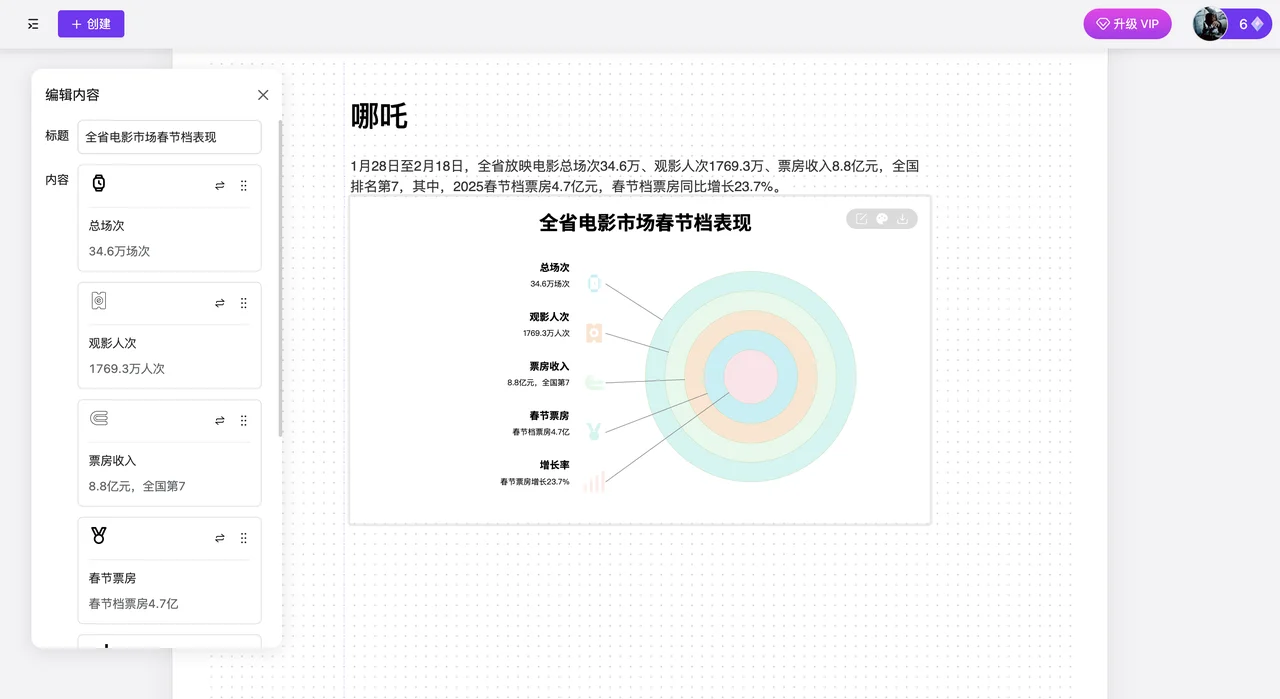
Click on the chart with your mouse, and an edit button will appear in the upper right corner. Click edit to bring up the editing window.
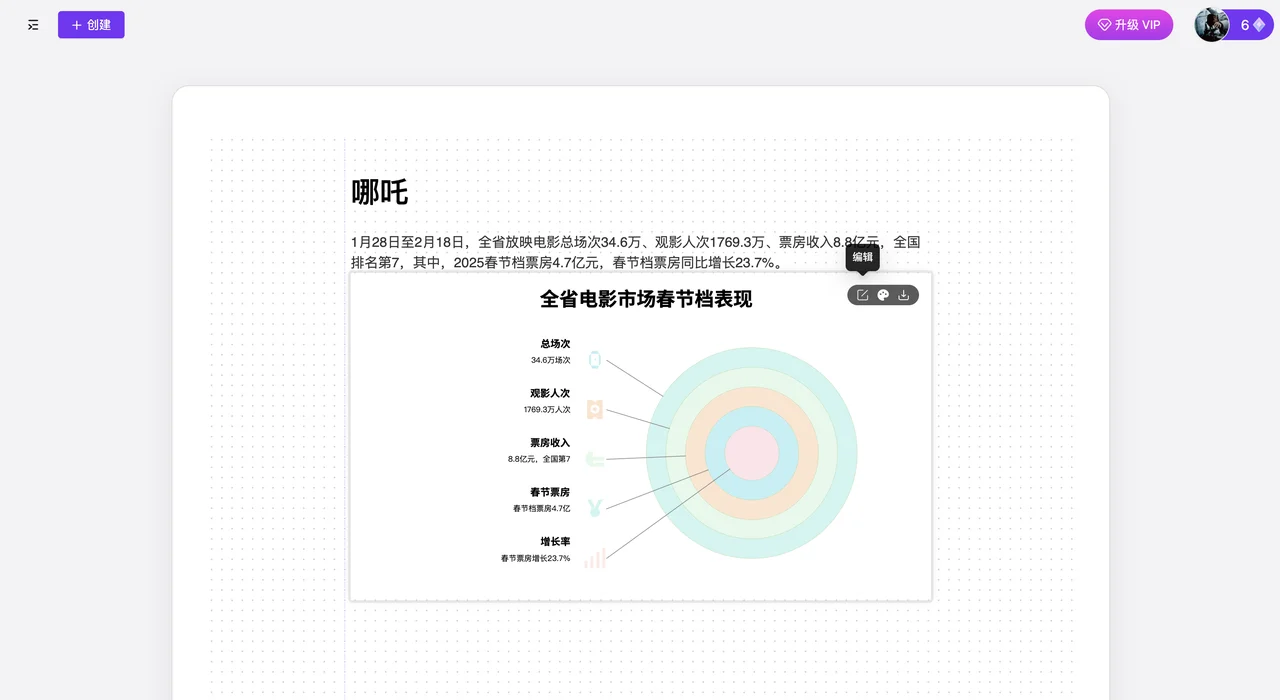
Edit within the pop-up window
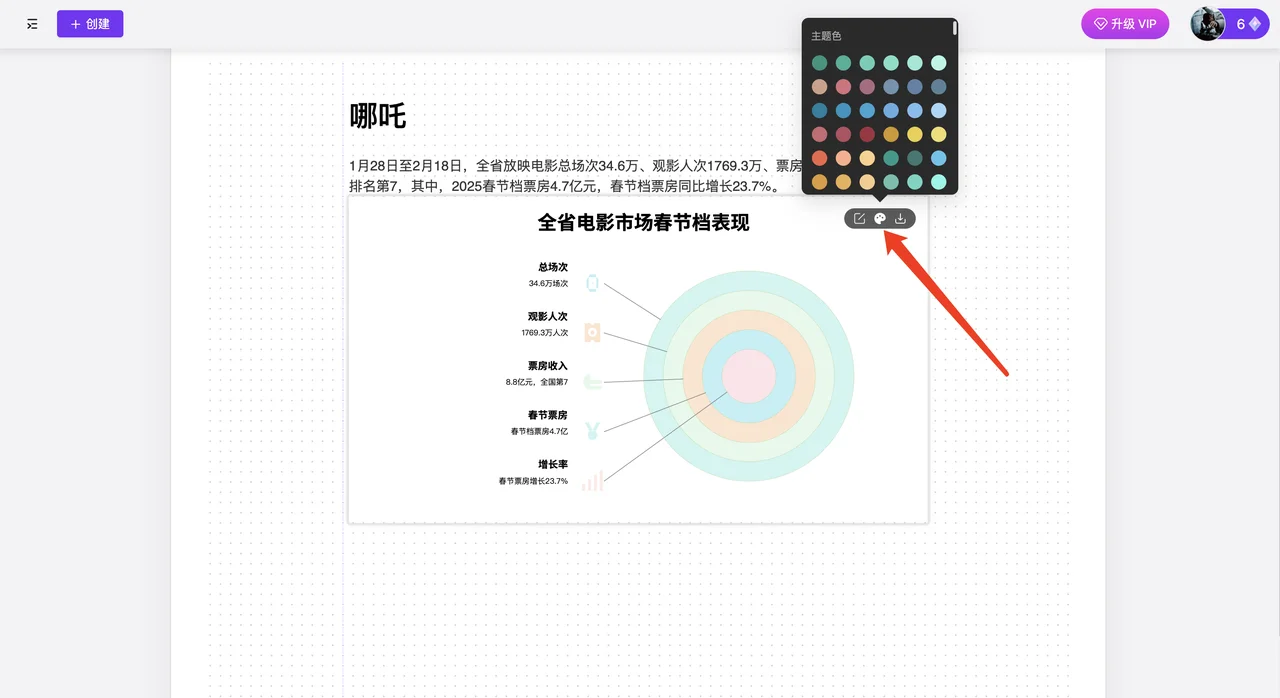
3. How to Change Theme Colors
Click on the chart with your mouse, and a theme color button will appear in the upper right corner. Click it to bring up the theme color selection window, where you can change the theme color according to your preference.
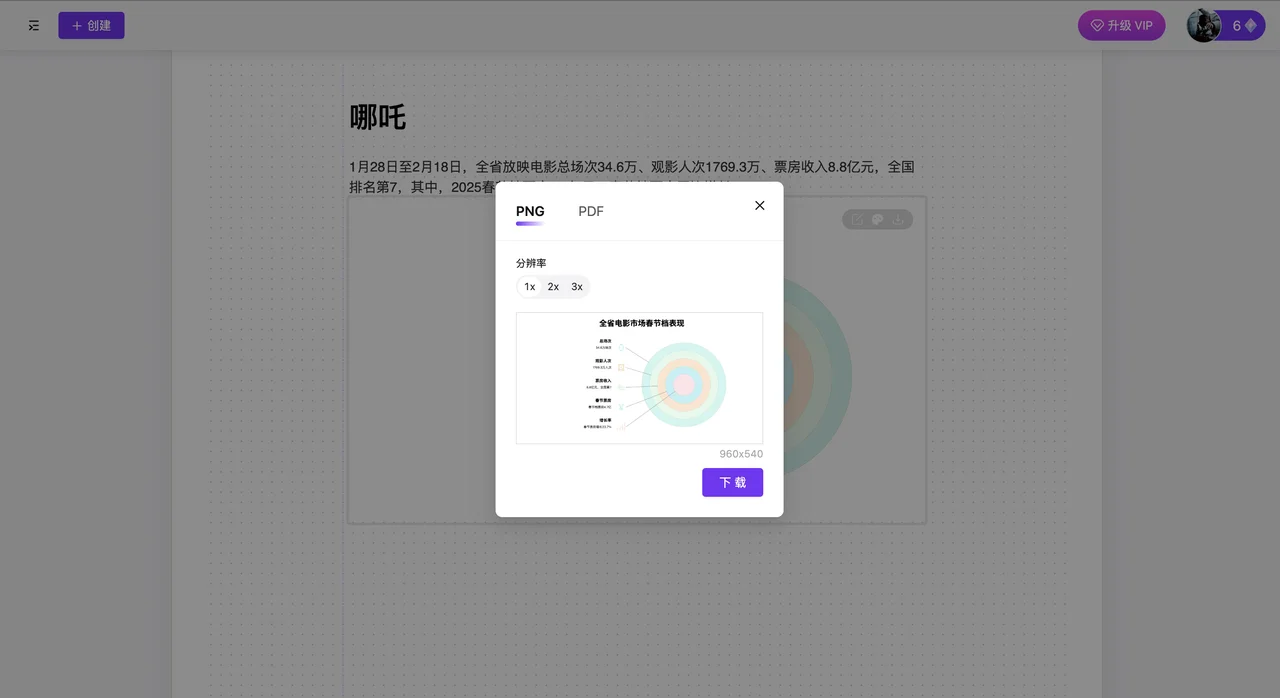
4. How to Download Charts
Click on the chart with your mouse, and a download button will appear in the upper right corner. Click it to bring up the download window.
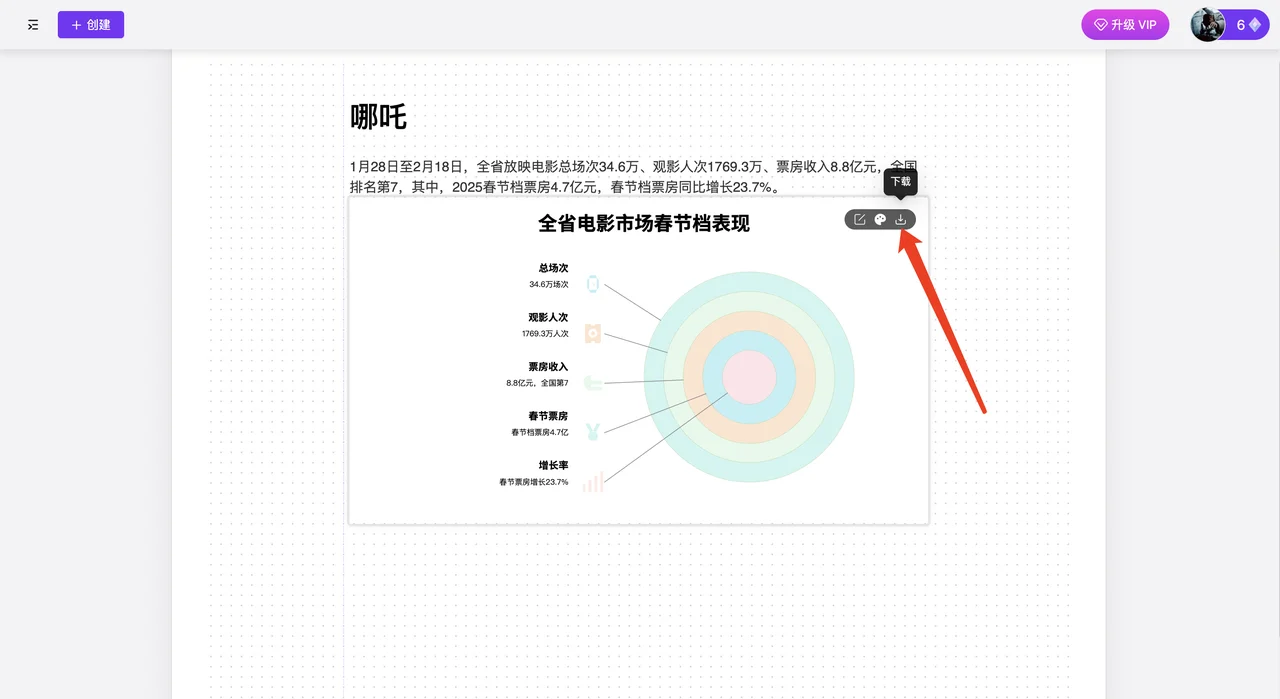
Download in PNG or PDF format according to your needs.
The above is the basic user guide for VisDoc. It is very simple to use. In upcoming versions, VisDoc will launch features such as AI text generation and AI image generation. The H5 version is expected to be released around March-April to meet the needs of mobile users, and an iPad version will also be available in the future.









